 Notification popup with Opalis
Incident Management in System Center Service Manager
I have been testing Incident Management (IM) with focus on the notification part of IM in System Center Service Manager beta 1.
The main goal of the IM process is to get back to a normal service operation as quickly as possible and to minimize the impact on the business, in other words ensuring that the best possible levels of service quality and availability are maintained. “Normal service operation†is defined within Service Level Agreement (SLA).
 In my test environment I built the following workflow:

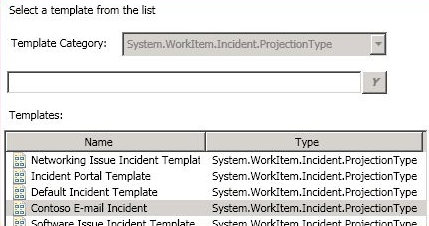
Incident templates can be utilized to achieve IM flexibility. Incident templates include common settings for different types of incidents. For example when a service desk receives a call from a user who can´t access a network folder, the service desk operator can then apply the network issue incident template and make sure all the necessary information is collected from the user reporting the incident. The templates also guarantee that incidents are configured with correct owner, category, priority and other related items.
System Center Service Manager has a connector to System Center Configuration Manager that synchronizes hardware information and other relevant information to Service Manager. When a service desk creates an incident and selects which machine the affected user is working from, the service desk can see all information synchronized from Configuration Manager.

In Service Manager there are a number of workflows out of the box and you can also create your own. One of them is Incident Change.

In my test environment I built the following four workflows:
1. One workflow sends e-mail to the affected user when new incidents are created. It is always good for the user to have the incident ID and to know which service desk has begun working on the incident.
2. One workflow sends an e-mail notification to the operator who is configured as “assigned to†in the incident. If it is not the same operator creating the incident who will be working on it, it is good to send a notification.
3. One workflow sends an e-mail notification to the operator who is configured as “assigned to†in the incident. If another operator adds a comment or information to the incident a notification will be sent to the operator who is assigned to the incident.
4. One workflow sends an e-mail notification to both the affected user and the operator who is configured as “assigned to†in the incident.
Service Manager synchronizes information from Active Directory through an AD connector so e-mail addresses and other account information already exists in Service Manager. Here we don’t have to create recipients the same way as we do with subscribers in Operations Manager.
It is reasonably easy to configure incident templates and notifications based on them. There are a couple of scenarios where I could see a need of more detailed criteria parameters. But as this is Service Manager beta 1 I guess we will see a lot more features in the RTM version. I think that the biggest obstacle will not be to how to configure Service Manager but instead how to plan and design all your workflows before you can input them into Service Manager.
Query a database with a monitor
I have seen a number of questions about how to run queries against a database and verify the answer. One way is to run a script inside a monitor. In this blog I wrote how to setup a script in a two state monitor. The script in this post will count number of fields, if there are more then five, status of the monitor will be changed. Note that counting starts at 0 with fields collection.
 Const adOpenStatic = 3
Const adLockOptimistic = 3
Set oAPI = CreateObject(“MOM.ScriptAPI”)
Set oBag = oAPI.CreatePropertyBag()
Set objConnection = CreateObject(“ADODB.Connection”)
Set objRecordSet = CreateObject(“ADODB.Recordset”)
objConnection.Open _
“Provider=SQLOLEDB;Data Source=R2B1;” & _
“Trusted_Connection=Yes;Initial Catalog=ContosoConfiguration;” & _
“User ID=CORP\Administrator;Password=;”
objRecordSet.Open “SELECT * FROM roles”, _
objConnection, adOpenStatic, adLockOptimistic
varNo = objRecordSet.Record.Count
If varNO > 5 Then
Call oBag.AddValue(“SQL_Status”,”Error”)
Else
Call oBag.AddValue(“SQL_Status”,”Ok”)
End If
Call oAPI.Return(oBag)
Microsoft TechDays 2009
![]()
Björn Axell (also Ops Mgr MVP) and I will deliver two sessions at TechDays 2009 in Västerås/Sweden. Our sessions are
- Operations Manager 2007 och System Center Essentials Tips and Tricks
- Managing Unix/Linux with Microsoft System Center Operations Manager 2007 R2 Cross Platform
In our first session we will be showing a lot of tips and tricks from the real world, answers to common questions, and ways to work with the products to get more out of them. In our second session we will be showing how you can monitor non Microsoft boxes with Operations Manager 2007 R2. Of course there will be a lot of demos.
You can find more info about the event here.Â
Alert Level and Alert Severity
In MOM 2005 we had seven (10,20,30,40,50,60,70) alert severities. In Ops Mgr 2007 we only have three, critical, information and warning. If you convert a management pack or download a converted management pack you can see in the XML code that for example a rule is genering an alert with AlertLevel 50. If you want to create new views and notification subscriptions for that alert you need to know how alert level is translated to alert severity in Ops Mgr 2007. I did a test with a rule from a converted Biz Talk management pack. I trigged the same rule, but between each test I changed alert level.
Alert Level 70Â Critical Alert Severity
Alert Level 60Â Critical Alert Severity
Alert Level 50Â Critical Alert Severity
Alert Level 40Â Critical Alert Severity
Alert Level 30Â Warning Alert Severity
Alert Level 20Â Information Alert Severity
Alert Level 10Â Information Alert Severity
All alert had low priority.
Review a Generic Text Log with Ops Mgr Reporting
I received a question about reviewing log files with Operations Manager reporting. There are rule to collect text log, but not out of the box report to look at the result. In this scenario you don’t want an alert based on the content of the log file, you only want to collect it and review it.
Start by creating a Collection Rule/Generic CSV Text Log rule. Configure it to collect everything from the file on the expression page, in my example (for a CSV log file)
Parameter Name: Params/Param[1]
Operator: Matches Wildcard
Value: *
Directory: C:\LogFiles\
Pattern: logfile.log
Separator: ,
To review the data we will use the Custom Event report. Unfortunately there is a known issue regarding this, the report does not display data where filter rules includes a parameter between 1 and 20, such as Parameter 1. To fix this you have to install hotfix 954823.

To review the log file with the Custom Event report choose to filter object equals FQDN of the machine with the log file, object type equals Windows Computer, Category equals 3 and Channel equal GenericCSVLog.

Recent Comments