Home » Microsoft Operations Management Suite
Category Archives: Microsoft Operations Management Suite
 Related dates in Service Manager views
 Moving a VHD between storage accounts
Building an Azure dashboard with server performance data
I guess all of you have seen the dashboards in Azure, the first page when login to the Azure portal. In some case, there are some resources that you by mistake pin while deploying, and in some case, it is just blank. In this blog post, I would like to share how to build a simple server health dashboard with basic performance data from servers (CPU workload, free disk space, and free memory). To set up this we need to do three main tasks
- Connect Data sources to get data into Log Analytics
- Configure queries to collect the needed data
- Pin dashboard/view to Azure Dashboard
Connect Data Sources
If your servers are Azure virtual machines you can read some performance data (see image) direct from the VM using the Azure VM agent, but unfortunately nothing about free memory, CPU or free disk space.

To collect the required data we need to install an agent inside the OS. Azure Log Analytic (often called OMS) provides features for collect data and from different sources. Log Analytic also provide features around visualize and analyze the collected data.
In Log Analytics we first need to install the agent on all servers, more information about that here. Once all servers are connected to the workspace the next step is to start collection performance data. You can enable specific performance counters under Advanced settings / Data / Windows Performance Counters or Linux Performance Counters. In the image, it is Windows Performance Counters shown, but of course, you can also do this with Linux Performance Counters too. It is the same steps for Linux servers, install the agent and then enable performance counters.

In this example, we will add the following performance counters, and configure sample interval for every 10 seconds.
- Memory(*)\Available MBytes
- LogicalDisk(*)\Free Megabyte
- LogicalDisk(*)\% Free Space
- Processor(_Total)\% Processor Time
Building Queries
Next step is to configure queries to visualize the collected data. There are a lot of good information about building queries and working with performance data here and here. But to save you some time you can use the following queries as a foundation,
These queries show the average for each minute (1minutes), based on the data we collect every 10 seconds.
Disk, % Free Space. This query will show % free space on each logical disk that has an instance name that contains “:†(this filter out, for example, mount points volumes on DPM servers).
Perf | where ObjectName == “LogicalDisk” and CounterName == “% Free Space” | where InstanceName contains “:” | summarize FreeSpaceP = avg(CounterValue) by bin(TimeGenerated, 1minutes), CounterPath| sort by TimeGenerated desc | render timechart
Disk, Free Megabytes
Perf | where ObjectName == “LogicalDisk” and CounterName == “Free Megabytes” | where InstanceName contains “:” | summarize FreeSpaceMb = avg(CounterValue) by bin(TimeGenerated, 1minutes), CounterPath| sort by TimeGenerated desc | render timechart
Memory, Available MBytes
Perf | where ( ObjectName == “Memory” ) | where ( CounterName == “Available MBytes” ) | summarize FreeMemMb = avg(CounterValue) by bin(TimeGenerated, 1minutes), CounterPath| sort by TimeGenerated desc | render timechart
Processor, % Processor Time
Perf | where ( ObjectName == “Processor” ) | where ( CounterName == “% Processor Time” ) | where ( InstanceName == “_Total” ) | summarize CPU= avg(CounterValue) by bin(TimeGenerated, 1minutes), CounterPath| sort by TimeGenerated desc | render timechat
It can take some time before the first data is collected. If you don’t see any data when you run the queries, take another cup of coffee and try again a bit later 😊

Building a view
We now have all data sources connected and queries to visualize the data. The next step is to build views in Log Analytics. This is not requirements to build an Azure Dashboard but is nice to have.
Log Analytics View Design is a feature that we can use to build custom views. These views can later be pinned to the Azure Dashboard. To save you some time you can download “Contoso Example Log Analytics Dashboard†(Contoso Servers) and import into View Designer.


Pin tiles to the Azure Dashboard – Log Analytics tile
There are two ways to pin a tile to the Azure dashboard that we will look at. The first one is to right-click a tile in Log Analytics and select pin to the dashboard. You can see this process in the following two images. On the Azure Dashboard you will see the view tile from the Log Analytics solution, if you click it you will go into Log Analytics and the specific solution. In this example, you can’t see processor, memory or disk performance direct on the Azure Dashboard.


Pin tiles to the Azure Dashboard – Advanced Analytics
The second alternative is to pin charts directly from the Advanced Analytics portal inside of Log Analytics. The Advanced Analytics feature provides advanced functionality not available in the Log Search portal, for example, Smart Analytics. In Log Analytics, click Analytics, to open up the Advanced Analytics portal. In the advanced analytics portal run the queries from this blog post, and click “Pin†on the right side. Once the different charts/queries are pinned to the Azure dashboard you can select them, click Edit, and change title and description on them.


Disclaimer: Cloud is very fast-moving target. It means that by the time you’re reading this post everything described here could have been changed completely.
Note that this is provided “AS-IS†with no warranties at all. This is not a production ready solution for your production environment, just an idea and an example.
Inside the Microsoft Operations Management Suite [e-book] version 2 now public
It took some time and a lot of writing, testing, editing, investigation, and discussion, but now it is finally here!
Download your copy here.
Big thanks for the discussions and collaboration to the authoring team, Tao Yang, Stanislav Zhelyazkov, the Pete Zerger and Kevin Greene.
Happy reading 🙂
Keep your Azure subscription tidy with Azure Automation and Log Analytics
When delivering Azure training or Azure engagements there is always a discussion about how important it is to have a policy and a lifecycle for Azure resources. Not only do we need a process to deploy resources to Azure, we also need a process to remove resources. From a cost perspective this is extra important, as an orphan IP address or disk will cost many, even if they are not in use. We also need policy to make sure everything is configured according to company policy. Much can be solved with ARM policies, but not everything. For example, you can’t make sure all resources have locks configured.
To keep the Azure subscription tidy and to get an event/recommendation when something is not configured correctly we can use an Azure Automation and OMS Log Analytics. In this blog post, I will show an example how this can be done 😊 The data flow is
- Azure Automation runbook triggers based on a schedule or manual. The runbook run several checks, for example if there are any orphan disks.
- If there is anything that should be investigated an event is created in OMS Log Analytics.
- In the OMS portal, we can build a dashboard to get a good overview of these events.
The example dashboard shows (down the example dashboard here)
- Total number of recommendations/events
- Number of resource types with recommendations
- Number of resources groups with recommendations. If each resource group correspond to a service, it is easy to see number of services that are not configured according to policy

The runbook is this example checks if there are any disks without an owner, any VMs without automatically shut down, any public IP addresses not in use and databases without lock configured. The runbook is based on PowerShell and it is easy to add more checks. The runbook submit data to OMS Log Analytics with Tao Yang PS module for OMSDataInjection, download here. That show up in Log Analytics as a custom log called ContosoAzureCompliance_CL. The name of the log can be changed in the runbook.
The figure below shows the log search interface in the OMS portal. On the left side, you can see that we can filter based on resource, resource type, severity and resource group. This makes it easy to drill into a specific type of resource or resource group.

Disclaimer: Cloud is very fast-moving target. It means that by the time you’re reading this post everything described here could have been changed completely.
Note that this is provided “AS-IS†with no warranties at all. This is not a production ready solution for your production environment, just an idea and an example.
Process OMS Log Analytic data with Azure Automation
Log Analytic in OMS provides a rich set of data process features for example custom fields. But there are scenarios were the current feature set is not enough.
In this scenario, we have a custom logfile that log messages from an application. From time to time the log file contains information about number of files in an application queue. We would like to display number of files in queue as a graph in OMS. Custom Fields will not work in this scenario as the log entries has many different log entry formats, OMS cannot figure out the structure of the log entries when not all of them follow the same structure. OMS don´t support custom field based on a subquery of the custom log entries, which otherwise could be a solution.

The example (in this blog post) is to ship the data to Azure Automation, process it, and send it back in suitable format to Log Analytics. This can be done in two different ways,
- 1 – Configure a alert rule in Log Analytics to send data to Azure Automation. Azure Automation process the data and send it to OMS as a new custom log
- 2 – Azure Automation connect to Log Analytics and query the data based on a schedule. Azure Automation process the data and send it to OMS as a new custom log
It is important to remember that events in Log Analytics don´t have a ID. Either solution we choose we must build a solution that makes sure all data is processed. If there is an interruption between Log Analytics and Azure Automation it is difficult to track which events that are already processed.
One thing to note is that Log Analytic and Azure Automation show time different. It seems like Azure Automation use UTC when display time properties of the events, but the portal for Log Analytic (the OMS portal) use the local time zone (in my example UTC+2hours). This could be a bit tricky.
1 – A Alert Rule push data to Azure Automation
In this example we need to do configuration both in Azure Automation and Log Analytics. The data flow will be
- Event is inserted into Log Analytics
- Event trigger Alert Rule in Log Analytics that trigger an Azure Automation runbook
- Azure Automation get the data from the webhook and process it
- Azure Automation send back data to Log Analytics as a new custom log
To configure this in Log Analytics and Azure Automation, follow these steps
- In Azure Automation, import AzureRM OperationalInsight PowerShell module. This can be done from the Azure Automation account module gallery. More information about the module here
- Create a new connection of type OMSWorkSpace in the in the Azure Automation account
- Import the example runbook, download from WebHookDataFromOMS
- In the runbook, update OMSConnection name, in the example named OMS-GeekPlayGround
- In the runbook, you need to update how the data is split and what data you would like to send back to OMS. In the example I send back Computer, TimeGenerated and Files to Log Analytic
- Publish the runbook
- In Log Analytics, configure an Alert Rule to trigger the runbook

- Done !

2 – Azure Automation query log analytic
In this example we don´t need to configure anything on the Log Analytic side. Instead all configuration is done on the Azure Automation side. The data flow till be
- Events are inserted into Log Analytic
- Azure Automation query Log Analytic based on a schedule
- Azure Automation get data and process it
- Azure Automation send back data to Log Analytic as a new custom log
To configure this in Azure Automation, follow these steps
- Import Tao Yang PS module for OMSDataInjection into your Azure Automation account. Navigate to PS Gallery and click Deploy to Azure Automation
- Import the AzureRM OperationalInsight PowerShell module. This can be done from Azure Automation account module gallery. More information about the module here.
- Create a new connection of type OMSWorkSpace in the Azure Automation account
- Verify that there is a connection to the Azure subscription that contains the Azure Automation account. In my example the connection is named “AzureRunAsConnection”
- Import the runbook, download here, GetOMSDataAndSendOMSData in TXT format
- In the runbook, update OMSConnection name, in the example named OMS-GeekPlayGround
- In the runbook, update Azure Connection name, in the example named AzureRunAsConnection
- In the runbook, update OMS workspace name, in the example named geekplayground
- In the runbook, update Azure Resource Group name, in the example named “automationresgrp”
- In the runbook, update the Log Analytic query that Azure Automation run to get data, in the example “Type=ContosoTestApp_CL queue”. Also update the $StartDateAndTime with correct start time. In the example Azure Automation collect data from the last hour (now minus one hour)
- In the runbook, you need to update how the data is split and what data you would like to send back to OMS. In the example I send back Computer, TimeGenerated and Files to Log Analytic.
- Configure a schedule to execute the runbook with suitable intervals.
Both solutions will send back number of files in queue as double data type to Log Analytic. One of the benefits of building a custom PowerShell object and convert it to JSON before submitting it to Log Analytic, is that you can easy control data type. If you simple submit data to Log Analytic the data type will be detected automatically, but sometimes the automatic data type is not what you except. With the custom PS object you can control it. Thanks to Stan for this tip. The data will be stored twice in Log Analytic, the raw data and the processed data from Azure Automation.

Disclaimer: Cloud is very fast moving target. It means that by the time you’re reading this post everything described here could have been changed completely.
Note that this is provided “AS-IS†with no warranties at all. This is not a production ready solution for your production environment, just an idea and an example.
Inside the Operations Management Suite e-book
Pete, Tao, Stanislav and I are working on version two of the “Inside the Microsoft Operations Management Suite” e-book. The book will be released around May 2017. The book will be 16 chapters and include an enormous amount of information, tips, deep dives and knowledge around the full range of Microsoft OMS features and functionality 🙂
You can already download preview chapters 🙂 All info about the book is here including download link for early chapter preview.
Monitor a Minecraft server with OMS (including moonshine perf counters)
From time to time I play Minecraft with friends. As a former SCOM geek I have of course configured monitoring for this server :) The server in this blogpost is a Windows server but most of the example works the same for a Minecraft server running on Linux. On the Minecraft server there are two types of resources that I would like to monitor, server performance and Minecraft logs.
The first part, server performance, is easy to solve. I installed the OMS agent on the server and enabled Windows performance monitoring for processor, memory, disk queue and network traffic. Those are all out of the box OMS features.
For Minecraft there is a log file, %Minecraft%\logs\latest.log, that Minecraft use to log everything around “the world” running in the server. In this log file you can see players joined, disconnected and some player activity like achievements or if a player dies. You can also use the log file to see if the server is running and if the world is ready. In OMS under Settings/Data/Custom Logs you can configure OMS to collect data from this log file. Note the name of the custom log, as it is the type you use to search for this events. In my example I have setup custom log named WinMinecraftLog_CL (_CL is added automatically). More info about configure custom log here.

We can use Log Search to review collected data (Type=WinMinecraftLog_CL) from the log file. Custom Fields can be used to add a new searchable field for the log severity, in this example OMS extract WARN and INFO and store it as WinMinecraftLogSeverity_CF. More information about custom fields here.

Another interesting thing to monitor on a Minecraft server is number of connected players. Unfortunately the Minecraft server don’t have a performance counter for this or an easy way to read it from the server. But you can count number of connections on the Minecraft port (default port 25565) 🙂 I have created a PowerShell script to count number of connections and write it as a new performance counter to the local server. The script also count number of unique players that have logged on to the server (number of files in the %Minecraft%\world\playerdata folder) and writes it as a performance counter. The script can be download here, WritePerfData. Thanks to Michael Repperger for the perf count example.


These two performance counters can then be collected by OMS as Windows Performance counters

Once all data is collected, both Minecraft specific and server data, OMS View Designer can be used to build a Minecraft dashboard (more info about View Designer here) The dashboard in gives us an overview of the Minecraft server, both from performance and Minecraft perspective. This example dashboard also includes a list of events from the log file, showing if there is a lot of warning events in the log file. Each tile in the dashboard is a link to OMS Log Search that can be used to drill deeper into the data.

Next step could be to index and measure more fun World specific number, for example achievements and most dangerous monster in the Minecraft world 🙂 On the server there is a folder, %Minecraft%\world\stats , with numbers about each user in the world, for example number of threes cut down or blocks built, these could also be fun numbers to collect 🙂
Disclaimer: Cloud is very fast moving target. It means that by the time you’re reading this post everything described here could have been changed completely.
Monitoring Azure Backup Server with Microsoft Operations Management Suite
In this post I would like to share some ideas around monitoring Azure Backup Server and backup jobs with Microsoft Operations Management Suite (OMS). OMS comes with a solution for Azure Backup. With this solution I can see that the Azure Backup vault protect 3 servers and is using a total of X GB. If I click on “3 registered servers” I can see that these three servers are my Azure Backup Servers. The machines that are being protected by the backup servers are not shown. As a backup administrator you often need to know more than number of backup servers and used space. In this blog post I will show you how to collect and visualize that information with OMS J


The first thing to do is to install the OMS agent on the Azure Backup Server. Once the agent installation is successfully completed it is time to configure OMS to collect DPM events. Add the DPM Backup Events, DPM Alerts and CloudBackup event logs under Settings/Data. But before any events are written to these event logs, Azure Backup Server needs to be configured to publish backup events and alerts. This configuration is done in the Microsoft Azure Backup console, in the Management workspace under Options.


Once backup related events are starting to come in to OMS it is time to configure filters to visualize what we want to see. The following filter will get all successfully backup jobs. Event ID 33222 is successful backup job and event id 33223 is failed backup job.
Type=Event EventLevelName=information EventID = 33222 TimeGenerated>NOW-8HOURS | sort Computer
But as you can see in the figure all values in the computer column is the Azure Backup Server. I would like to see what data source was protected and also on which server. To do this, you can use custom fields in OMS. With custom fields we can extract data from the event and index it as a new fields.

In the next two figures I have extracted protected server and data source from 33222 event and 33223 events, from the ParameterXML parameters. As you can see, we now have a column for the protected server and one column for the data source. We could combine this to one filter, showing both failed and successfully jobs. But I think it is better with two filters when we start using these filters in My Dashboard.


We could also run a query like this to get all machines and latest successfully backup

It can also be interesting with a filter to show all protected servers that don’t have a successful backup for last X hours. In my lab environment I have some events from before I extracted fields from the events, as you can see below.

Once we have our filters and saved them to favorites we can use them in My Dashboard. We now have a quick start overview of out backup jobs on the Azure Backup Server. Of course you can add a number of filters to get more information to your dashboard.

Free E-book: Inside the Microsoft Operations Management Suite
Tao (@MrTaoYang), Stan (@StanZhelyazkov), Pete (@pzerger) and I have been working on a project for the last few weeks. We wanted to bring a learning resource for the MS Operations Management Suite to the community that is complete, comprehensive, concise…and free (as in beer). While we finish final editing passes over the next couple of weeks, we wanted to share an early copy of the book so you can start digging in while we finish our work!
Description: This preview release of “Inside the Microsoft Operations Management Suite†is an end-to-end deep dive into the full range of Microsoft OMS features and functionality, complete with downloadable sample scripts (on Github). The chapter list in this edition is shown below:
- Chapter 1: Introduction and Onboarding
- Chapter 2: Searching and Presenting OMS Data
- Chapter 3: Alert Management
- Chapter 4: Configuration Assessment and Change Tracking
- Chapter 5: Working with Performance Data
- Chapter 6: Process Automation and Desired State Configuration
- Chapter 7: Backup and Disaster Recovery
- Chapter 8: Security Configuration and Event Analysis
- Chapter 9: Analyzing Network Data
- Chapter 10: Accessing OMS Data Programmatically
- Chapter 11: Custom MP Authoring
- Chapter 12: Cross Platform Management and Automation
Download your copy here!
Using Custom Fields in OMS
Last week I was working with custom fields in Operations Management Suite (OMS). I would like to share an example were to use custom fields. In this example we have a custom application named Contoso Invoicing Software that writes events (event Id 580) to the application event log. These events are collected by OMS but the challenges is that the event description is not a searchable field, in the first example the event description is “User profile cant be loaded”. The goal is to have the event description as a filter on the left side of the Log Explorer.

With custom fields we can tell OMS to index the event description and show it as a filter. Click next to, in this example the ParameterXML field, and select Extract fields from…

Select the text you want OMS to learn, and input a name for the new field.
Click Extract and you will see a message that OMS is now learning
Once the learning process is complete you will see a summary on the right side and can click Save Extraction.


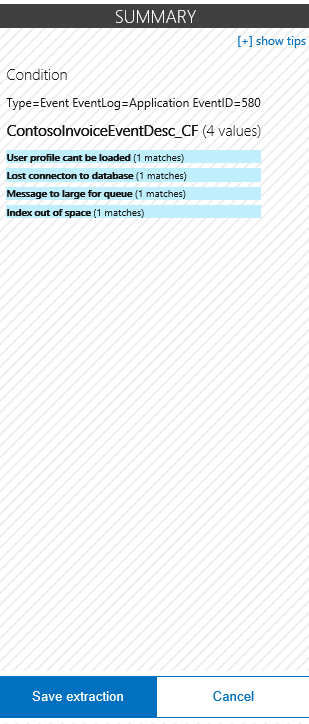
You have now learned OMS to extract the data from events with ID 580 in the Application log. This now works on all new events, not on all events. Once new data has arrived to OMS you can filter and group based on the new custom field J


Recent Comments