“Argument is null or empty†error when running post-steps script in Azure Site Recovery
A couple of days ago I was working on Azure Site Recovery post-step scripts with my colleague Jonathan. The scenario was to fail over two virtual machines running in the West Europe Azure region to the North Europe Azure region. Enable replication between two Azure regions is not complicated, but not all components are supported to fail over between regions, for example, public IP addresses are not. To get all details about supported scenarios see the Azure Site Replication support matrix here. To set up network after failover we wrote an Azure Automation runbook and connected the runbook to our failover plan as a post-steps script. After Azure Site Recovery has run all fail failover steps it triggers the post-steps scripts. But we ran into some strange errors in our post step scripts and would like to share the solution with the community.
When doing test failover everything looked ok from the Azure Site Recovery perspective. Our two virtual machines failed over and the first script was triggered. The script will add public IP addresses to the two machines. 
But when looking in Azure Automation on the runbook job we could see that something was not working.

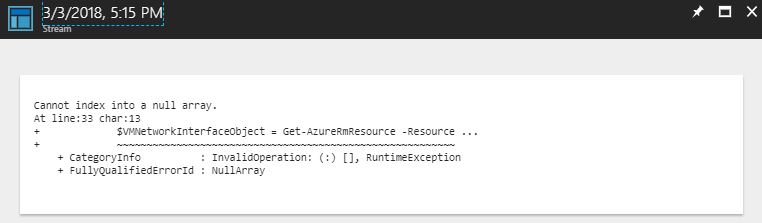

The runbook could not find the new virtual machine resources in the pre-created resource group. After a couple of different tests, we realized that the new Azure virtual machine resources in North Europe were not ready when the runbook was triggered by the recovery plan.
If we added a small delay on a couple of minutes in the script everything worked perfectly 🙂
Building an Azure dashboard with server performance data
I guess all of you have seen the dashboards in Azure, the first page when login to the Azure portal. In some case, there are some resources that you by mistake pin while deploying, and in some case, it is just blank. In this blog post, I would like to share how to build a simple server health dashboard with basic performance data from servers (CPU workload, free disk space, and free memory). To set up this we need to do three main tasks
- Connect Data sources to get data into Log Analytics
- Configure queries to collect the needed data
- Pin dashboard/view to Azure Dashboard
Connect Data Sources
If your servers are Azure virtual machines you can read some performance data (see image) direct from the VM using the Azure VM agent, but unfortunately nothing about free memory, CPU or free disk space.

To collect the required data we need to install an agent inside the OS. Azure Log Analytic (often called OMS) provides features for collect data and from different sources. Log Analytic also provide features around visualize and analyze the collected data.
In Log Analytics we first need to install the agent on all servers, more information about that here. Once all servers are connected to the workspace the next step is to start collection performance data. You can enable specific performance counters under Advanced settings / Data / Windows Performance Counters or Linux Performance Counters. In the image, it is Windows Performance Counters shown, but of course, you can also do this with Linux Performance Counters too. It is the same steps for Linux servers, install the agent and then enable performance counters.

In this example, we will add the following performance counters, and configure sample interval for every 10 seconds.
- Memory(*)\Available MBytes
- LogicalDisk(*)\Free Megabyte
- LogicalDisk(*)\% Free Space
- Processor(_Total)\% Processor Time
Building Queries
Next step is to configure queries to visualize the collected data. There are a lot of good information about building queries and working with performance data here and here. But to save you some time you can use the following queries as a foundation,
These queries show the average for each minute (1minutes), based on the data we collect every 10 seconds.
Disk, % Free Space. This query will show % free space on each logical disk that has an instance name that contains “:†(this filter out, for example, mount points volumes on DPM servers).
Perf | where ObjectName == “LogicalDisk” and CounterName == “% Free Space” | where InstanceName contains “:” | summarize FreeSpaceP = avg(CounterValue) by bin(TimeGenerated, 1minutes), CounterPath| sort by TimeGenerated desc | render timechart
Disk, Free Megabytes
Perf | where ObjectName == “LogicalDisk” and CounterName == “Free Megabytes” | where InstanceName contains “:” | summarize FreeSpaceMb = avg(CounterValue) by bin(TimeGenerated, 1minutes), CounterPath| sort by TimeGenerated desc | render timechart
Memory, Available MBytes
Perf | where ( ObjectName == “Memory” ) | where ( CounterName == “Available MBytes” ) | summarize FreeMemMb = avg(CounterValue) by bin(TimeGenerated, 1minutes), CounterPath| sort by TimeGenerated desc | render timechart
Processor, % Processor Time
Perf | where ( ObjectName == “Processor” ) | where ( CounterName == “% Processor Time” ) | where ( InstanceName == “_Total” ) | summarize CPU= avg(CounterValue) by bin(TimeGenerated, 1minutes), CounterPath| sort by TimeGenerated desc | render timechat
It can take some time before the first data is collected. If you don’t see any data when you run the queries, take another cup of coffee and try again a bit later 😊

Building a view
We now have all data sources connected and queries to visualize the data. The next step is to build views in Log Analytics. This is not requirements to build an Azure Dashboard but is nice to have.
Log Analytics View Design is a feature that we can use to build custom views. These views can later be pinned to the Azure Dashboard. To save you some time you can download “Contoso Example Log Analytics Dashboard†(Contoso Servers) and import into View Designer.


Pin tiles to the Azure Dashboard – Log Analytics tile
There are two ways to pin a tile to the Azure dashboard that we will look at. The first one is to right-click a tile in Log Analytics and select pin to the dashboard. You can see this process in the following two images. On the Azure Dashboard you will see the view tile from the Log Analytics solution, if you click it you will go into Log Analytics and the specific solution. In this example, you can’t see processor, memory or disk performance direct on the Azure Dashboard.


Pin tiles to the Azure Dashboard – Advanced Analytics
The second alternative is to pin charts directly from the Advanced Analytics portal inside of Log Analytics. The Advanced Analytics feature provides advanced functionality not available in the Log Search portal, for example, Smart Analytics. In Log Analytics, click Analytics, to open up the Advanced Analytics portal. In the advanced analytics portal run the queries from this blog post, and click “Pin†on the right side. Once the different charts/queries are pinned to the Azure dashboard you can select them, click Edit, and change title and description on them.


Disclaimer: Cloud is very fast-moving target. It means that by the time you’re reading this post everything described here could have been changed completely.
Note that this is provided “AS-IS†with no warranties at all. This is not a production ready solution for your production environment, just an idea and an example.
Inside the Microsoft Operations Management Suite [e-book] version 2 now public
It took some time and a lot of writing, testing, editing, investigation, and discussion, but now it is finally here!
Download your copy here.
Big thanks for the discussions and collaboration to the authoring team, Tao Yang, Stanislav Zhelyazkov, the Pete Zerger and Kevin Greene.
Happy reading 🙂
Keep your Azure subscription tidy with Azure Automation and Log Analytics
When delivering Azure training or Azure engagements there is always a discussion about how important it is to have a policy and a lifecycle for Azure resources. Not only do we need a process to deploy resources to Azure, we also need a process to remove resources. From a cost perspective this is extra important, as an orphan IP address or disk will cost many, even if they are not in use. We also need policy to make sure everything is configured according to company policy. Much can be solved with ARM policies, but not everything. For example, you can’t make sure all resources have locks configured.
To keep the Azure subscription tidy and to get an event/recommendation when something is not configured correctly we can use an Azure Automation and OMS Log Analytics. In this blog post, I will show an example how this can be done 😊 The data flow is
- Azure Automation runbook triggers based on a schedule or manual. The runbook run several checks, for example if there are any orphan disks.
- If there is anything that should be investigated an event is created in OMS Log Analytics.
- In the OMS portal, we can build a dashboard to get a good overview of these events.
The example dashboard shows (down the example dashboard here)
- Total number of recommendations/events
- Number of resource types with recommendations
- Number of resources groups with recommendations. If each resource group correspond to a service, it is easy to see number of services that are not configured according to policy

The runbook is this example checks if there are any disks without an owner, any VMs without automatically shut down, any public IP addresses not in use and databases without lock configured. The runbook is based on PowerShell and it is easy to add more checks. The runbook submit data to OMS Log Analytics with Tao Yang PS module for OMSDataInjection, download here. That show up in Log Analytics as a custom log called ContosoAzureCompliance_CL. The name of the log can be changed in the runbook.
The figure below shows the log search interface in the OMS portal. On the left side, you can see that we can filter based on resource, resource type, severity and resource group. This makes it easy to drill into a specific type of resource or resource group.

Disclaimer: Cloud is very fast-moving target. It means that by the time you’re reading this post everything described here could have been changed completely.
Note that this is provided “AS-IS†with no warranties at all. This is not a production ready solution for your production environment, just an idea and an example.
Process OMS Log Analytic data with Azure Automation
Log Analytic in OMS provides a rich set of data process features for example custom fields. But there are scenarios were the current feature set is not enough.
In this scenario, we have a custom logfile that log messages from an application. From time to time the log file contains information about number of files in an application queue. We would like to display number of files in queue as a graph in OMS. Custom Fields will not work in this scenario as the log entries has many different log entry formats, OMS cannot figure out the structure of the log entries when not all of them follow the same structure. OMS don´t support custom field based on a subquery of the custom log entries, which otherwise could be a solution.

The example (in this blog post) is to ship the data to Azure Automation, process it, and send it back in suitable format to Log Analytics. This can be done in two different ways,
- 1 – Configure a alert rule in Log Analytics to send data to Azure Automation. Azure Automation process the data and send it to OMS as a new custom log
- 2 – Azure Automation connect to Log Analytics and query the data based on a schedule. Azure Automation process the data and send it to OMS as a new custom log
It is important to remember that events in Log Analytics don´t have a ID. Either solution we choose we must build a solution that makes sure all data is processed. If there is an interruption between Log Analytics and Azure Automation it is difficult to track which events that are already processed.
One thing to note is that Log Analytic and Azure Automation show time different. It seems like Azure Automation use UTC when display time properties of the events, but the portal for Log Analytic (the OMS portal) use the local time zone (in my example UTC+2hours). This could be a bit tricky.
1 – A Alert Rule push data to Azure Automation
In this example we need to do configuration both in Azure Automation and Log Analytics. The data flow will be
- Event is inserted into Log Analytics
- Event trigger Alert Rule in Log Analytics that trigger an Azure Automation runbook
- Azure Automation get the data from the webhook and process it
- Azure Automation send back data to Log Analytics as a new custom log
To configure this in Log Analytics and Azure Automation, follow these steps
- In Azure Automation, import AzureRM OperationalInsight PowerShell module. This can be done from the Azure Automation account module gallery. More information about the module here
- Create a new connection of type OMSWorkSpace in the in the Azure Automation account
- Import the example runbook, download from WebHookDataFromOMS
- In the runbook, update OMSConnection name, in the example named OMS-GeekPlayGround
- In the runbook, you need to update how the data is split and what data you would like to send back to OMS. In the example I send back Computer, TimeGenerated and Files to Log Analytic
- Publish the runbook
- In Log Analytics, configure an Alert Rule to trigger the runbook

- Done !

2 – Azure Automation query log analytic
In this example we don´t need to configure anything on the Log Analytic side. Instead all configuration is done on the Azure Automation side. The data flow till be
- Events are inserted into Log Analytic
- Azure Automation query Log Analytic based on a schedule
- Azure Automation get data and process it
- Azure Automation send back data to Log Analytic as a new custom log
To configure this in Azure Automation, follow these steps
- Import Tao Yang PS module for OMSDataInjection into your Azure Automation account. Navigate to PS Gallery and click Deploy to Azure Automation
- Import the AzureRM OperationalInsight PowerShell module. This can be done from Azure Automation account module gallery. More information about the module here.
- Create a new connection of type OMSWorkSpace in the Azure Automation account
- Verify that there is a connection to the Azure subscription that contains the Azure Automation account. In my example the connection is named “AzureRunAsConnection”
- Import the runbook, download here, GetOMSDataAndSendOMSData in TXT format
- In the runbook, update OMSConnection name, in the example named OMS-GeekPlayGround
- In the runbook, update Azure Connection name, in the example named AzureRunAsConnection
- In the runbook, update OMS workspace name, in the example named geekplayground
- In the runbook, update Azure Resource Group name, in the example named “automationresgrp”
- In the runbook, update the Log Analytic query that Azure Automation run to get data, in the example “Type=ContosoTestApp_CL queue”. Also update the $StartDateAndTime with correct start time. In the example Azure Automation collect data from the last hour (now minus one hour)
- In the runbook, you need to update how the data is split and what data you would like to send back to OMS. In the example I send back Computer, TimeGenerated and Files to Log Analytic.
- Configure a schedule to execute the runbook with suitable intervals.
Both solutions will send back number of files in queue as double data type to Log Analytic. One of the benefits of building a custom PowerShell object and convert it to JSON before submitting it to Log Analytic, is that you can easy control data type. If you simple submit data to Log Analytic the data type will be detected automatically, but sometimes the automatic data type is not what you except. With the custom PS object you can control it. Thanks to Stan for this tip. The data will be stored twice in Log Analytic, the raw data and the processed data from Azure Automation.

Disclaimer: Cloud is very fast moving target. It means that by the time you’re reading this post everything described here could have been changed completely.
Note that this is provided “AS-IS†with no warranties at all. This is not a production ready solution for your production environment, just an idea and an example.
Experts Live Europe
I will deliver a session at Experts Live Europe in Berlin, August 23-25. My session is “Lessons learned from Microsoft Premier Support – Manage and control your Azure resources” and will show you how organizations manage and control their Microsoft Azure resources in real world situations 🙂
Experts Live Europe is one of Europe’s largest community conferences with an focus on Microsoft cloud, datacenter and workplace management. Top experts from around the world present discussion panels, ask-the-experts sessions and breakout sessions and cover the latest products, technologies and solutions.Â
More info about the event and registration here. See you there!

Upload VHD and create new VM with managed disk
In this post I would like to share scripts and steps I used to create a new Azure VM with managed disks based on a uploaded Hyper-V VHD file. There is a number of things to do before uploading the VHD to Azure. Microsoft Docs has a good checklist here with steps how-to prepare a Windows VM to be uploaded to Azure. Some of the most important things to think about is that the disk must have a fixed size, be in VHD format and the VM must be generation 1. It is also recommended to enable RDP (😊) and install the Azure VM Agent. The overall steps are
- Create a Azure storage account
- Prepare the server according to the link above
- Export the disk in VHD format with fixed size
- Build a new VM with the exported disk. This is not required, but can be a good thing to do just to verify that the exported VHD file works before uploaded to Azure
- Upload the VHD file
- Create a new VM based on the VHD file
- Connect to the new VM and verify everything works
- Delete the uploaded VHD file
The following figure show the storage account configuration were the VHD file is stored
 The following image show the upload process of the VHD file… the last image show creation of the new VM


The script I used to upload the VHD file
Login-AzureRmAccount -SubscriptionId 9asd3a0-aaaaa-4a1c-85ea-4d11111110be5$localfolderpath = “C:\Export”
$vhdfilename = “LND-SRV-1535-c.vhd”
$rgName = “migration-rg”
$storageaccount = “https://migration004.blob.core.windows.net/upload/”$localpath = $localfolderpath + “\” + $vhdfilename
$urlOfUploadedImageVhd = $storageaccount + $vhdfilename
Add-AzureRmVhd -ResourceGroupName $rgName -Destination $urlOfUploadedImageVhd -LocalFilePath $localpath -OverWrite
The script I used to create the new VM. Note that the script connects the new VM to the first subnet on a VNET called CONTOSO-VNET-PRODUCTION. Also note that the size of the VM is set to Standard_A2.
Login-AzureRmAccount -SubscriptionId 9asd3a0-aaaaa-4a1c-85ea-4d11111110be5$vmName = “LND-SRV-1535”
$location = “West Europe”
$rgName = “migration-rg”
$vhdfile = “LND-SRV-1535-c”
$vhdsize = “25”
$sourceVHD = “https://migration004.blob.core.windows.net/upload/” + $vhdfile + “.vhd”### Create new managed disk based on the uploaded VHD file
$manageddisk = New-AzureRmDisk -DiskName $vhdfile -Disk (New-AzureRmDiskConfig -AccountType StandardLRS -Location $location -CreateOption Import -SourceUri $sourceVHD -OsType Windows -DiskSizeGB $vhdsize) -ResourceGroupName $rgName### Set VM Size
$vmConfig = New-AzureRmVMConfig -VMName $vmName -VMSize “Standard_A2”### Get network for new VM
$vnet = Get-AzureRMVirtualNetwork -Name CONTOSO-VNET-PRODUCTION -ResourceGroupName CONTOSO-RG-NETWORKING
$ipName = $vmName + “-pip”
$pip = New-AzureRmPublicIpAddress -Name $ipName -ResourceGroupName $rgName -Location $location -AllocationMethod Dynamic
$nicName = $vmName + “-nic1”
$nic = New-AzureRmNetworkInterface -Name $nicName -ResourceGroupName $rgName -Location $location -SubnetId $vnet.Subnets[0].Id -PublicIpAddressId $pip.Id
$vm = Add-AzureRmVMNetworkInterface -VM $vmConfig -Id $nic.Id### Set disk
$vm = Set-AzureRmVMOSDisk -Name $manageddisk.Name -ManagedDiskId $manageddisk.Id -CreateOption Attach -vm $vm -Windows### Create the new VM
New-AzureRmVM -ResourceGroupName $rgName -Location $location -VM $vm

Finding correct permissions for custom roles in Azure RBAC
In Azure you can assign user, group and services access to different resources. It is of course a good idea to assign as exact permissions as possible to each user, group or service. Too many permissions mean that for example a user can affect more resources than planned and expose a larger attack surface. Too few permissions mean that the user can’t do their job in an effective way. With Azure Role-Based Access Control (RBAC) you can assign each user, group or service only the amount of permissions they need to perform their job. Azure RBAC comes with many built-in roles, for more information about the built-in roles click here.
In some scenarios, the built-in roles are not suitable to the scenario. That is when we can build our own roles 😊 Custom roles can be assigned users, groups and services, just like the built-in roles. They can also be shared among all subscriptions that use the same Azure AD. I wrote a blog post about custom roles in October, Setting up team permissions with custom RBAC role and ARM policy. That blog post cover everything around getting started with custom roles.
But sometimes it is difficult to find correct operations for your custom roles. For example, in this scenario, a user is assigned the built-in Contributor role to a resource group. The user can then create/edit/delete any resource within the resource group, but cannot delete the resource group or change access to it. But the user also need permissions to administrate locks on resources in the resource group. Â There is no lock administrator role built-in instead we need to build it.

Finding correct Azure operations for locks administration is made easy with the following Powershell script
$collection = Get-AzureRmProviderOperation *
foreach ($item in $collection)
{
    $desc = $item.Description
    If ($desc -like "*locks*")
        {
            $item.Operation
        }
}
The script goes through all providers and operations in Azure and checks for each operation that have “locks†in the description.

We can then use the locks operations we just found to build a new custom RBAC role, described in the blog post around RBAC from October (link earlier in this post). As you can see in the figure below the role is assigned to the entire subscription. By doing this it is easy to use the role on multiple places within the subscription.


In this blog post we have seen how we can find operators for Azure custom RBAC roles. Each operator control a task or action that a user, group or service can do. Assigning the correct amount of permissions to a role will both increase security and the possibilities to effectively work. Try to use groups instead of users when assigning permissions, as you would do in your Windows Server Active Directory. Assigning permissions to groups instead of users will make administration easier.
Inside the Operations Management Suite e-book
Pete, Tao, Stanislav and I are working on version two of the “Inside the Microsoft Operations Management Suite” e-book. The book will be released around May 2017. The book will be 16 chapters and include an enormous amount of information, tips, deep dives and knowledge around the full range of Microsoft OMS features and functionality 🙂
You can already download preview chapters 🙂 All info about the book is here including download link for early chapter preview.
Inside Microsoft Azure IaaS [free e-book]
A long time ago in a galaxy… far far away…
We started to work on this book early last year I think it was. It has been a lot of changes, updates, new features and services in Azure. But now finally it is public 🙂 The book provides a hands-on guide to utilizing Infrastructure-as-a-Service (IaaS) resources in Azure, with a primary focus on Azure Virtual Machines. Additional content covered in the book includes Azure PowerShell, Azure Virtual Networking, Azure Storage, Connecting Azure to your Datacenter, Migration, and Backup & Disaster Recovery.
Authors are Ryan Irujo, Janaka Rangama, Pete Zerger and me.
Download your copy of the free e-book here.
happy reading 🙂
Recent Comments