Setting up heartbeat failure alerts with Azure Monitor
One of the questions we receive regularly is how to use the Azure Monitor components to alert on machines that are not available, and then how to create availability reports using these tools.
My colleague Vanessa and I have been looking at the best ways of achieving this in a way that those who are migrating from tools like System Center Operations Manager would be familiar and comfortable with.
As the monitoring agent used by Azure Monitor on both Windows and Linux sends a heartbeat every minute, the easiest method to detect a server down event, regardless of server location, would be to alert on missing heartbeats. This means you can use one alert rule to notify for heartbeat failures, even if machines are hosted on-prem.
Log Ingestion Time and Latency
Before we look at the technical detail, it is worth calling out the Log Ingestion Time for Azure Monitor. This is particularly important if you are expecting heartbeat missed notifications within a specific time frame. In the Log Ingestion Time article, the following query is shared, which you can use to view the computers with the highest ingestion time over the last 8 hours. This can help you plan out the thresholds for the alerting settings.
Heartbeat | where TimeGenerated > ago(8h) | extend E2EIngestionLatency = ingestion_time() - TimeGenerated | summarize percentiles(E2EIngestionLatency,50,95) by Computer | top 20 by percentile_E2EIngestionLatency_95 desc
Alerting
You can use the following query in Logs to retrieve machines that have not sent a heartbeat in the last 5 minutes:Heartbeat
| summarize LastHeartbeat=max(TimeGenerated) by Computer
| where LastHeartbeat < ago(5m)
The query, based on Heartbeat, is good for reporting and dashboarding, but often using the Heartbeat Metric in the alert rule fields gives faster results. Read more about Metrics here. To create an alert rule based on metrics, you want to target the Workspace resource still, but, in the condition, you want to use the Heartbeat metric signal:

You will now be able to configure the alert options.

- Select the computers to alert on. You can choose Select All
- Change to Less or equal to, and enter 0 as your threshold value
- Select your aggregation granularity and frequency
The best results we have found during testing is an alert within two minutes of a machine shut down, with the above settings – keeping the ingestion and latency in mind.
Using these settings, you should get an alert for each unavailable machine within a few minutes after it becomes unavailable. But, as the signal relies on the heartbeat of the agent, this may also alert during maintenance times, or if the agent is stopped.
If you need an alert quickly, and you are not concerned with an alert flood, then use these settings.
However, if you want to ensure that you only alert on valid server outages, you may want to take a few additional steps. You can use Azure Automation Runbooks or Logic Apps as an alert response to perform some additional diagnostic steps, and trigger another alert based on the output. This could replicate the method used in SCOM with a Heartbeat Failure alert and a Failed to Connect alert.
If you are only monitoring Azure Hosted virtual machines, you could also use the Activity Log to look for Server Shutdown events, using the following query:AzureActivity
| where OperationName == "Deallocate Virtual Machine" and ActivityStatus == "Succeeded"
| where TimeGenerated > ago(5m)
Reporting
Conversations about server unavailable alerts invariably lead to questions around the ability to report on Server Update/Availability. In the Logs blade, there are a few sample queries available relating to availability:

With the availability rate query by default returning the availability for monitored virtual machines for the last hour, but also providing you with an availability rate query that you can build on. This can be updated to show the availability for the last 30 days as follows:
let start_time=startofday(now()-30d);
 let end_time=now();
 Heartbeat
| where TimeGenerated > start_time and TimeGenerated < end_time
| summarize heartbeat_per_hour=count() by bin_at(TimeGenerated, 1h, start_time), Computer | extend available_per_hour=iff(heartbeat_per_hour>0, true, false)
| summarize total_available_hours=countif(available_per_hour==true) by Computer
| extend total_number_of_buckets=round((end_time-start_time)/1h)+1
| extend availability_rate=total_available_hours*100/total_number_of_buckets
Or, if you are storing more than one month of data, you can also modify the query to run for the previous month:
let start_time=startofmonth(datetime_add('month',-1,now()));
 let end_time=endofmonth(datetime_add('month',-1,now()));
 Heartbeat
| where TimeGenerated > start_time and TimeGenerated < end_time
| summarize heartbeat_per_hour=count() by bin_at(TimeGenerated, 5m, start_time), Computer | extend available_per_hour=iff(heartbeat_per_hour>0, true, false)
| summarize total_available_hours=countif(available_per_hour==true) by Computer
| extend total_number_of_buckets=round((end_time-start_time)/5m)+1
| extend availability_rate=total_available_hours*100/total_number_of_buckets
These queries can be used in a Workbook to create an availability report

Note that the availability report is based on heartbeats, not the actual service running on the server. For example, if multiple servers are part of an availability set or a cluster, the service might still be available even if one server is unavailable.
Further reading
- Manage Metric Alerts
- Metric Alerts on Logs
- Agent Health Solution
- Using Azure Automation to take action on Azure Alerts
- Implement a Logic App action on an Alert
- Create Interactive Reports using Workbooks
Disclaimer: Cloud is a very fast-moving target. It means that by the time you’re reading this post, everything described here could have been changed completely. The blog post is provided “AS-IS†with no warranties.
Monitor a process with Azure Monitor
A common question when working with Azure Monitor is monitoring of Windows services and processes running on Windows servers. In Azure Monitor we can monitor Windows Services and other processes the same way; by looking at process ID as a performance counter.
Even if a process can be monitored by looking at events, it is not always a reliable source. The challenge is that there is no “active monitoring†checking if the process is running at the moment when looking at only events.
Each process writes a number of performance counters. None of these are collected by default in Azure Monitor, but easy to add under Windows Performance Counters.


The following query will show process ID for Notepad. If the Notepad process is not running, there will be no data. The alert rule, if needed, can be configured to generate an alert if zero results was returned during the last X minutes.
Perf
| where (Computer == “LND-DC-001.vnext.local”) and (CounterName == “ID Process”) and (ObjectName == “Process”)
| where InstanceName == “notepad”
| extend localTimestamp = TimeGenerated + 2h
| where TimeGenerated > ago(5m)
| project TimeGenerated , CounterValue, InstanceName
| order by TimeGenerated desc

Disclaimer:
Cloud is a very fast-moving target. It means that by the time you’re reading
this post everything described here could have been changed completely.
Note that this is provided
“AS-IS†with no warranties at all. This is not a production-ready solution for
your production environment, just an idea, and an example.
Inside Azure Management [e-book]
We are excited to announce the Preview release of Inside Azure Management is now available, with more than 500 pages covering many of the latest monitoring and management features in Microsoft Azure!
March 27, 2019] We are excited to announce the Preview release of Inside Azure Management is now available, with more than 500 pages covering many of the latest monitoring and management features in Microsoft Azure!
This FREE e-book is written by Microsoft MVPs Tao Yang, Stanislav Zhelyazkov, Pete Zerger, and Kevin Greene, along with Anders Bengtsson.
Description: “Inside Azure Management” is the sequel to “Inside the Microsoft Operations Management Suite”, featuring end-to-end deep dive into the full range of Azure management features and functionality, complete with downloadable sample scripts.
The chapter list in this edition is shown below:
- Chapter 1 – Intro
- Chapter 2 – Implementing Governance in Azure
- Chapter 3 – Migrating Workloads to Azure
- Chapter 4 – Configuring Data Sources for Azure Log Analytics
- Chapter 5 – Monitoring Applications
- Chapter 6 – Monitoring Infrastructure
- Chapter 7 – Configuring Alerting and notification
- Chapter 8 – Monitor Databases
- Chapter 9 – Monitoring Containers
- Chapter 10 – Implementing Process Automation
- Chapter 11 – Configuration Management
- Chapter 12 – Monitoring Security-related Configuration
- Chapter 13 – Data Backup for Azure Workloads
- Chapter 14 – Implementing a Disaster Recovery Strategy
- Chapter 15 – Update Management for VMs
- Chapter 16 – Conclusion
Download your copy here
Update Service Map groups with PowerShell
Service Map automatically discovers application components on Windows and Linux systems and maps the communication between services. With Service Map, you can view your servers in the way that you think of them: as interconnected systems that deliver critical services. Service Map shows connections between servers, processes, inbound and outbound connection latency, and ports across any TCP-connected architecture, with no

A common question is how to update machine groups in Service Map automatically. Last week my colleague Jose Moreno and I was worked with Service Map and investigated how to automate machine group updates. The result was a couple of PowerShell examples, showing how to create and maintain machine groups with PowerShell. You can find all the examples on Jose GitHub page. With these scripts we can now use a source, for example, Active Directory groups, to set up and update machine groups in Service Map.
Building reports with Log Analytics data
A common question I see is how to present the data collected with Log Analytics. We can use View Designer in Log Analytics, PowerBI, Azure Dashboard, and Excel PowerPivot. But in this blog post, I would like to show another way to build a “report†direct in the Azure Portal for Log Analytics data.
Workbooks is a feature in Application Insights to build interactive reports. Workbooks are configured under Application Insights but it’s possible to access data from Log Analytics.
In this example, we will build a workbook for failed logins in Active Directory. The source data (event Id 4625) is collected by the Security and Audit solution in Log Analytics.
If we run a query in Log Analytics to show these events, we can easily see failed login reason and number of events. But we would also like to drill down into these events and see account names. That is not possible in Log Analytics today, and this is where workbooks can bring value.

Any Application Insights instance can be used; no data needs to be collected by the instance (no extra cost) as we will use Log Analytics as a data source. In Application Insights, there are some default workbooks and quick start templates. For this example, we will use the “Default Template.â€

In the workbook, we can configure it to use any Log Analytics workspace, in any subscription, as a source. Using different workspaces for different parts of the workbook is possible. The query used in this example is shown below, note it shows data for the last 30 days.
SecurityEvent
| where AccountType == ‘User’ and EventID == 4625
| where TimeGenerated > ago(30d)
| extend Reason = case(
SubStatus == ‘0xc000005e’, ‘No logon servers available to service the logon request’,
SubStatus == ‘0xc0000062’, ‘Account name is not properly formatted’,
SubStatus == ‘0xc0000064’, ‘Account name does not exist’,
SubStatus == ‘0xc000006a’, ‘Incorrect password’,
SubStatus == ‘0xc000006d’, ‘Bad user name or password’,
SubStatus == ‘0xc000006f’, ‘User logon blocked by account restriction’,
SubStatus == ‘0xc000006f’, ‘User logon outside of restricted logon hours’,
SubStatus == ‘0xc0000070’, ‘User logon blocked by workstation restriction’,
SubStatus == ‘0xc0000071’, ‘Password has expired’,
SubStatus == ‘0xc0000072’, ‘Account is disabled’,
SubStatus == ‘0xc0000133’, ‘Clocks between DC and other computer too far out of sync’,
SubStatus == ‘0xc000015b’, ‘The user has not been granted the requested logon right at this machine’,
SubStatus == ‘0xc0000193’, ‘Account has expirated’,
SubStatus == ‘0xc0000224’, ‘User is required to change password at next logon’,
SubStatus == ‘0xc0000234’, ‘Account is currently locked out’,
strcat(‘Unknown reason substatus: ‘, SubStatus))
| project TimeGenerated, Account, Reason, Computer

In the workbook, on Column Settings, we can configure how the result will be grouped together. In this example, we will group by failed login reason and then account name.


When running the workbook, we get a list of failed login reasons and can expand to see account names and amount of failed logins. It is possible to add an extra filter to the query to remove “noise†for example accounts with less than three failed login events.
It is also possible to pin a workbook or part of a workbook, to an Azure Dashboard, to easily access the information.

In the

Ingestion Time in Log Analytics
A common topic around Log Analytics is ingestion time. How long time does it take before an event is visible in Log Analytics?
The latency depends on three main areas agent time, pipeline time and indexing time. This is all described in this Microsoft Docs article.
In Log Analytics or Kusto, there is a hidden DateTime column in each table called IngestionTime. The time of ingestion is recorded for each record, in that hidden column. The IngestionTime can be used to estimate the end-to-end latency in ingesting data to Log Analytics. TimeGenerated is a timestamp from the source system, for example, a Windows server. By comparing TimeGenerated and IngestionTime we can estimate the latency in getting the data into Log Analytics. More info around IngestionTime policy here.
In the image below a test event is generated on a Windows, note the timestamp (Logged).

When the event is in Log Analytics, we can find it and compare IngestionTime and TimeGenerated. We can see that the difference is around a second. TimeGenerated is the same as “Logged†on the source system. This is just an estimate, as the clocks on the server and in Log Analytics might not be in sync.

If we want to calculate the estimated latency, we can use the following query. It will take all events and estimate the latency in minutes, and order it by latency.
Event
| extend LatencyInMinutes = datetime_diff('minute', ingestion_time(), TimeGenerated)
| project TimeGenerated, ingestion_time(), LatencyInMinutes
| order by LatencyInMinutes

You can also summaries the average latency per hour, and generated a chart, with the following query. This is useful when investigating latency over a longer period of time.
Event
| extend LatencyInMinutes = datetime_diff('minute', ingestion_time(), TimeGenerated)
| project TimeGenerated, ingestion_time(), LatencyInMinutes
| summarize avg(LatencyInMinutes) by bin(TimeGenerated, 1h)

Disclaimer: Cloud is a very fast-moving target. It means that by the time you’re reading this post everything described here could have been changed completely.
Note that this is provided “AS-IS†with no warranties at all. This is not a production-ready solution for your production environment, just an idea, and an example.
Analyze and visualize Azure Firewall with Log Analytics View Designer
A colleague and I have put together a sample view for Log Analytic to analyze and visualize Azure Firewall logs. You can download the sample view here. The sample view will visualize data around application rule and network rule log data. With view Designer in Azure Log Analytics, you can create custom views to visualize data in your Log Analytics workspace, read more about View Designer here.


Monitor Linux Daemon with Log Analytics
In this blog post I would like to share an example of how daemons on Linux machines can be monitored with Log Analytics. Monitoring daemons are not listed as a feature direct in the Log Analytic portal, but it is possible to do. When a daemon is started or stopped a line is written in Syslog. Syslog is possible to read with the Microsoft Monitoring Agent and send to Log Analytics.
The only thing to configure is to enable collection of Syslog and the daemon facility.
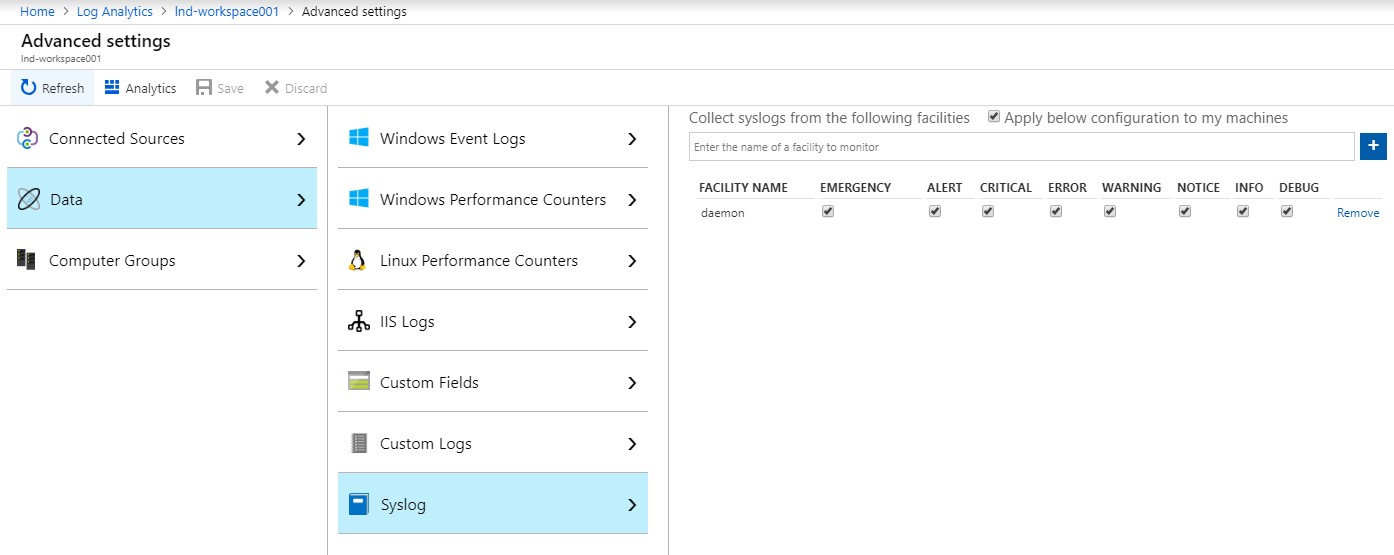
If the daemon is stopped (the cron daemon in this example) the following lines are written to the syslog logfile
![]()
Soon after the same lines are written to Log Analytics as events in the Syslog table

You can now configure an alert including notification when the daemon stops. The alert can, for example, be visualized in Azure Monitor and sent by e-mail.


Disclaimer: Cloud is a very fast-moving target. It means that by the time you’re reading this post everything described here could have been changed completely.
Note that this is provided “AS-IS†with no warranties at all. This is not a production-ready solution for your production environment, just an idea, and an example.
Deploying a central auditing workspace with Log Analytics
One or multiple workspaces
A common question when talking Log Analytics design is one or multiple workspaces. Should there be one central workspace with all data? Should there be one workspace per application? Should there be one workspace for the auditing team? There are many different ideas and scenarios, but a common component is a central workspace for auditing. One workspace where a central team can track security-related events, assessments, and alerts.
The following topics are often involved when the decision to use one or multiple workspaces
- In which region do we need to store the data, for example, the data must be stored within EU
- Data Retention. The number of days to store the data is configured on a workspace level. That means that we will need to pay for the same retention setting on all our data within a workspace. If we have some data that needs to be stored for 7 days and some important data needs to be stored for 200 days, we will need to pay and store all data for 200 days.
- Data Access. Today the workspace is the security boundary for Log Analytics. If we, for example, have log data from two different teams, that are not allowed to see each other’s data, we will need to store them in different workspaces.
- Data Collection. Today there are solutions and data collection settings that are set on workspace level. For example, we enable collection of warnings in the Application log on Windows servers, it will be collected from all connected Windows servers, even if we only need it from some of our servers. This can affect the total cost in a negative way if collecting data not needed. In this scenario, it might be an idea to connect some servers to one workspace and others to another workspace.
When decided to use multiple workspaces it is possible to multi-home Windows servers to send data to multiple workspaces. For Linux servers and some other data sources, for example, multiple PaaS services can today send data to one workspace. One thing to note when configuring multi-home data sources is that if the same data is collected and inserted into multiple workspaces, we also pay for that data twice. In other words, it is a good idea to make sure that different kind of data is collected for each workspace, for example, audit data to one workspace and application logs to another.
The following figure describes a scenario where two application teams have their own workspaces, and there is one workspace for central auditing. The auditing team needs access to data from both service workspaces, to run analyzes and verify that everything is running according to company policies.

To deploy this scenario simple deploy three workspaces and give the central auditing team read permissions on each service workspace, see Microsoft Docs for more details.
Cross workspace queries
The next step is to start author queries to analyze and visualize the data. The data is stored in each service workspace so the Auditing team will need to use the cross-workspace query feature, read more about it (https://docs.microsoft.com/en-us/azure/log-analytics/log-analytics-cross-workspace-search). Data is only stored in the two service workspaces, there is no data in the central auditing workspace.
The following query is a cross workspace query example, query two workspaces and list failed logon events. In the query we use “isfuzzy†to tell Log Analytics that execution of the query will continue even if the underlying table or view reference is not present. We can also see the two workspace ID, one for each service workspace, and that we use the SecurityEvent table.
union isfuzzy=true
workspace(“b111d916-5556-4b3c-87cf-f8d93dad7ea0”).SecurityEvent, workspace(“0a9de77d-650f-4bb1-b12f-9bcdb6fb3652”).SecurityEvent
| where EventID == 4625 and AccountType == ‘User’
| extend LowerAccount=tolower(Account)
| summarize Failed = count() by LowerAccount
| order by Failed desc
The following example shows all failed security baseline checks for the two service workspaces
union isfuzzy=true
workspace(“b111d916-5556-4b3c-87cf-f8d93dad7ea0”).SecurityBaseline, workspace(“0a9de77d-650f-4bb1-b12f-9bcdb6fb3652”).SecurityBaseline
| where ( RuleSeverity == “Critical” )
| where ( AnalyzeResult == “Failed” )
| project Computer, Description
To make cross workspace queries a bit easier we can create a function. For example, run the following query and save it then as a function.
union isfuzzy=true
workspace(“b111d916-5556-4b3c-87cf-f8d93dad7ea0”).SecurityBaseline, workspace(“0a9de77d-650f-4bb1-b12f-9bcdb6fb3652”).SecurityBaseline

We can then call the function in our queries, for example, to get all failed security baseline checks. We don’t need to specify workspaces to join, as they are handled by the function.
ContosoSecEvents
| where ( RuleSeverity == “Critical” )
| where ( AnalyzeResult == “Failed” )
| project Computer, Description
Another way of using saved functions is the following example.
First, we have a saved function named ContosoCompMissingUpdates listing all computers that are missing updates.
union isfuzzy=true
workspace(“b111d916-5556-4b3c-87cf-f8d93dad7ea0”).Update, workspace(“0a9de77d-650f-4bb1-b12f-9bcdb6fb3652”).Update
| where UpdateState == ‘Needed’ and Optional == false and Classification == ‘Security Updates’ and Approved != false
| distinct Computer

We can then use the ContosoCompMissingUpdates function within a query showing machines with failed Security baseline checks. The result is a list of machines missing updates and with failed baseline checks.
ContosoSecEvents
| where ( RuleSeverity == “Critical” )
| where ( AnalyzeResult == “Failed” )
| where Computer in (ContosoCompMissingUpdates)
| project Computer, Description
Disclaimer: Cloud is a very fast-moving target. It means that by the time you’re reading this post everything described here could have been changed completely.
Note that this is provided “AS-IS†with no warranties at all. This is not a production-ready solution for your production environment, just an idea, and an example.
Exporting Azure Resource Manager templates with Azure Automation, and protecting them with Azure Backup
Earlier this week I put together a runbook to backup Azure Resource Manager (ARM) templates for existing Resource Groups. The runbook exports the resource group as a template and saves it to a JSON file. The JSON file is then uploaded to an Azure File Share that can be protected with Azure Backup.
The runbook can be downloaded from here, PS100-ExportRGConfig. The runbook format is PowerShell. The runbook might require an Azure PS module upgrade. I have noticed that in some new Azure Automation accounts, the AzureRM.Resources module doesn’t include Export-AzureRmResourceGroup and needs an update.

Inside of the runbook, you need to configure the following variables:
- Resourcegrouptoexport , this is the Resource Group you would like to export to a JSON file.
- storageRG, this is the name of the Resource Group that contains the file share you want to upload the JSON file to.
- storageAccountName, this is the name of the storage account that contains the Azure file share.
- filesharename, this is the name of the Azure file share in the storage account. On the Azure file share, there needs to be a directory named templates. You will need to create that directory manually.


When you run the runbook you might see warning messages. There might be some cases where the PowerShell cmdlet fails to generate some parts of the template. Warning messages will inform you of the resources that failed. The template will still be generated for the parts that were successful.


Once the JSON file is written to the Azure File Share you can protect the Azure file share with Azure Backup. Read more about backup for Azure file shares here.

Disclaimer: Cloud is a very fast-moving environment. It means that by the time you’re reading this post everything described here could have been changed completely. Note that this is provided “AS-IS†with no warranties at all. This is not a production ready solution for your production environment, just an idea, and an example.
Recent Comments