Home » Articles posted by Anders Bengtsson (Page 17)
Author Archives: Anders Bengtsson
Error initializing MAPI in Orchestrator or Opalis
Today I was building a runbook including a Send Exchange Email activity. Unfortunately it didn’t work, instead I had to troubleshoot for a moment. The error was “Error initializing MAPI”. This activity use a Outlook profile, so you need to have Outlook installed on the runbook server/action server that is going to execute the runbook/policy. In my case I had Outlook 2010 installed. Here are some of the things I checked to find the missing configuration, outlook profile on the action server for the correct service account 🙂
- Make sure you spell the Outlook profile name correct, else you will get a error saying it cant find the profile
- Make sure that Outlook profile exists on the action server that is going to run the runbook/policy. It needs to exist for the account that is executing the activity. In my case the action server service account. To make sure the profile exists, and to create it, logon to the runbook server/action server, start control panel, configure the profile. Then also start Outlook to make sure the profile is working.
- Make sure you execute the runbook/policy on the correct action server, where the service account has the Outlook profile
- Verify if the “Task fails if an attachment is missing” check box should be checked. If it is, and there is no attachment, the Send Exchange Email activity will fail.


Windows Computer and associated Health Service watcher in a dynamic group
A common scenario is that you want to group computers in groups based on SLA, responsibility or server teams. Groups are used to for example filter views and boundary in notifications. When looking at the Windows computer object you see everything you are monitoring on that machine (that rolls-up health to the Windows computer object). But you don’t get heartbeat missing alerts, as these are generated by the health service watcher for that machine. In the console you can build a group and dynamically include windows computer objects and health service objects. But an challenge is that for the health service objects there are not many attributes to filter on, and there is no feature in the console to do “put these machines and associated health service watchers in this groupâ€. The Windows Computer class we can extend with new attributes and it also includes a lot of attributes out of the box, but we cant do the same with health service. Building a suitable dynamic formula for the Windows Computer class is often not a challenge, the issue is to get associated health service watcher in there.
In this post I will group Windows computer objects and associated health service watcher together in a group, based on a registry string. The goal is to build one dynamic group for each SLA level. Each group should contain all machines that has that SLA level and also associated health service watchers. These groups can later be used of views and notification. I will start by extending the Windows Computer class with a new attribute. This attribute will be populated with a register string from each machine.
 To extend the Windows Class to discover a SLA string follow these steps
- In the Operations Manager Console navigate to Authoring, Management Pack Objects, Attributes
- Right-click Attributes and select Create a New Attribute…
- In the Create Attribute Wizard, General Properties, input a name, for example Contoso – SLA attribute
- In the Create Attribute Wizard, Discovery Method, select Registry as discovery type. Select Windows Computer as Target. Select suitable management pack or create a new management pack, for example Contoso – SLA
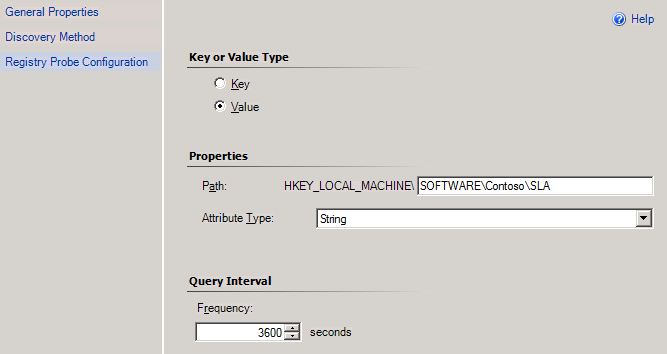
- In the Create Attribute Wizard, Registry Probe Configuration, input a path to the registry key and change attribute type to string.

- In production you should not run the discovery to often, often per 12 hour or 24 hours is fine. In a sandbox you could change it a bit to avoid waitning.
- Click Finish and close the Create Attribute Wizard
- Navigate to the Monitoring workspace. Create a new state view in the same management pack as you stored the new attribute. Configure the state view to show data related to Windows Computer_Extended, in my example from the Contoso – SLA management pack. Make sure you select to display the SLA attribute, Contoso – SLA Attribute, on the Display tab.
- Verify that you see your servers and a value in the Contoso – SLA column
The next step is to create a dynamic group, that includes all windows computers with Gold as SLA.
- Navigate to the Authroing workspace, select Groups, right-click and select Create a new Group
- In the Create Group Wizard, General Properties, input a name, for example Contoso – Gold Servers. Select the same management pack as your attribute
- In the Create Group Wizard, Dynamic Members, click Create/Edit rules
- In the Create Group Wizard – Query Builder, input the same settings as in the image below

- In the Create Group Wizard, Exclude Members, click Create
- Right-click the new group, View Group Members, verify that all your gold servers are in the group

The next step is a bit more complicated. We now need to export the new management pack, edit the XML code and import it again. Export the management pack under Management Packs in the Administration workspace. Make an extra copy of the XML file to make sure you have a backup. Open the exported management pack, the XML file, and search for <MembershipRules>. We need to add a second membership rule that groups associated health service watchers with computers already grouped by first membership rule. This second membership rule will add Health Service Watcher objects associated with a computer that is contained by this group. The management pack should look like this when you export it

we add the second discovery rule (see attached MP for code)

Save the management pack and import it into Operations Manager again. Repeat all steps for servers with silver SLA level. After you have imported the management pack, wait a couple of minutes (to let RMS re-calc group members) and then look at the members in the group.

You know have two groups, one for servers with silver SLA and one for servers with gold SLA. Both groups contains windows computer objects and health service watcher objects. You can use your new groups for example notification and views.You can download my MP here, Contoso.SLA  , please note that this is provided “as is†with no warranties at all. Thanks to Steve for ideas.
Opalis Log Purging
If your Opalis database is filled up with log entries the console performance will be affected. Navigating between folders in the console, viewing workflows or console “hangs†in general can be a result of to much log data in the database.By default the log purging feature is not enable in Opalis. The result of that is that no historical data is ever removed from the Opalis database, unless it is manually configured and then either executed by clicking on the “Purge Now†button, or scheduled by selecting the “Schedule Log Purgeâ€. In this post I will share some common practices around log purging and database maintenance for the Opalis database. The Log Purge Configuration dialog box can be accessed from the Opalis Integration Server Client by right-click and selecting Log Purge on server name in the navigation pane.

The purge feature will purge data from following three tables in the Opalis database
- Policyinstances
- Objectinstances
- Objectinstancedata
When working with the Opalis Integration Server Client you can review historical data in a couple of places
- The log tab, show you running policy instances
- The log history tab, will show you information on policy instances that have completed
- The Audit History tab will show changes made to a policy grouped by each time you click “check—inâ€
- The Events tab will show you events from Opalis, for example if you use the Send Platform Event activity within a policy
Both the Log tab and the Log History tab show you data from these three tables.

Both views, Log and Log History, show selected data from the POLCIINSTANCES table. When you click on a log entry, data for the objects in that policy instance are shown from the OBJECTINSTANCES table. When selecting an object, data for that object is read from the OBJECTINSTANCEDATA table.


The following query can be used to list Policy ID, Policy Name, SeqNumber, Action Server and Number of Instances. The Number of Instances is the indicator how often the Action Server executed the policy since the last log purge. This query is very helpful to see what policy is filling up your tables with historical data.
SELECT

[p].[UniqueID] AS [Policy ID],

[p].[Name] AS [Policy Name],

[prq].[SeqNumber],

[a].[Computer] AS [Action Server],

COUNT([pi].[UniqueID]) AS [Number Of Instances]

FROM        [POLICY_REQUEST_HISTORY] AS prq

INNER JOIN  [POLICIES] AS p ON [prq].[PolicyID] = [p].[UniqueID]

INNER JOIN  [POLICYINSTANCES] AS [pi] ON [prq].[SeqNumber] = [pi].[SeqNumber]

INNER JOIN  [ACTIONSERVERS] AS a ON [pi].[ActionServer] = [a].[UniqueID]

WHERE

[prq].[Active] = 1 AND

[pi].[TimeEnded] IS NOT NULL

GROUP BY

[p].[UniqueID],

[p].[Name],

[prq].[SeqNumber],

[a].[Computer]

ORDER BY

[Number Of Instances] DESC

Regarding backup of the Opalis database I have seen a couple of different solutions. The first solution is to export all policies and global settings. This will give you a simple way to restore, re-import the export files. You can do a quick re-install of the Opalis environment and import the files in case of a disaster. You can include the export part in your change management process; before you import a new policy into Opalis you also make a backup copy.
The second solution is to do a backup of the database; an advantage with this solution is that you keep all the historical data. But if you restore the database from a backup when there were policies running, you can run into some problem with state data. But you could execute the sp_StopAllRequests stored procedure to clear out any active requests and instances that aren’t desired. The restore process gets a little bit more complicated with the second solution.
With the first backup solution I recommend you, and that is a general recommendation, to keep state data/historical data in an external data store. For example we could use Service Manager to track what is happening. Opalis executes and Service Manager remembers. As soon as Opalis is done, it will drop everything, it only keeps it in memory during execution (and maybe some logs). Working with Service Manager will give us a great way to track everything. It could of course be any system that we can integrate with, for example an extra SQL database.
Thanks to my colleague Robert Riedmaier for sharing his deep knowledge around Opalis log purge, backup and database maintenance. Thanks Robert!
System Center Community Evaluation Program
You can now sign up for the Operations Manager 2012 and/or the System Center Orchestrator community evaluation program. This community evaluation program is designed to take you on a guided tour and evaluation of the product.
The Community Evaluation Program from the Management and Security team at Microsoft provides IT professionals a structured approach to evaluating System Center and Forefront products before their final release. Members of this program are able to evaluate early versions of products with guidance from the product team and by sharing of experiences and best practices among a community of peers.
To sign up at the Microsoft Connect website.
A question that has come up a few times is the difference between this CEP, and the Orchestrator TAP that some of you are participants in. The Table below should help you understand the differences in these two programs.
| Orchestrator TAP | Orchestrator CEP | |
| Access to Orchestrator Beta | Yes | Yes |
| Assigned Buddy from the product group | Yes | No |
| Required to deploy the RC into production | Yes | No |
| Information disclosure level | NDA | Public |
| Program Owner | Chris Hill | Adam Hall |
| Program duration | Beta through RTM | Beta only |
Save time for servicedesk with Opalis
In this post I want to give a simple example how you can use Opalis to save time for your service desk. Often the 1st line do the same tasks over and over again. For example when a user calls in a incident around access to the intranet, service desk connect to the desktop machine, check the same things every time and it is almost every time the same issue. Doing this every day is boring and it is easy that there is a difference between how service desk engineers perform these tasks.
This is where Opalis can help. Instead of resources from your service desk should do these simple tasks, let Opalis do them and then update the incident. Opalis will do it quick and exactly the same every time. If you need to change anything, change the workflow, and Opalis will instant start using the new settings. The following workflow is a example of what you could build to save some time. The next obvious phase would be to add more steps to also fix any problem that Opalis detect.

- The first activity checks for new incidents in Service Manager with classification category equals Desktop Problem
- Update the incident status to Opalis. This is to show that Opalis is working on the incident
- Get related computer, affected item, from the incidents. This is the machine where we will do all tests, as this is the machine the end-user has a problem with.

- Gets the windows computer object with the object GUID that we get from the “get related computer” activity
- Trigger the first troubleshooting workflow, “ping policy”
- If the first troubleshooting workflow did not found any issues the next troubleshooting workflow will start, process policy
- Change the incident status back to the status it had before activity 2 in the workflow

The first troubleshooting workflow is shown below. It will start by simple check if the desktop machine is accessible on the network with a simple ping. the workflow till update the incident with the result and then publish the result on the databus. I trigger the same workflow for both a good and a bad result. There are both disadvantage and advantage with that solution. I can use the same workflow for all my troubleshooting policies and that results in simple workflows. A disadvantage is that I cant add that much custom details to the incident update, for example in this example I will only update the incident action log saying the “ping policy” failed. There will be no info around number of pings that failed. I try to keep number of tests in my troubleshooting workflows to a minimum, so if a workflow fails we know direct what it is. For example instead of testing five processes in the same workflow, I can build multiple workflows with one test in each, then simple update the incident with the incident that failed. As the workflow only test one thing I know what the problem is, and I can use same error logging for all workflows.
 The incident update workflow generate a random number that will be used as ID for the action log comment in the incident. From each workflow that trigger it the workflow gets result, policy name of the calling workflow and computer name. These three attributes are used to generate the action log update.


Incident action log updated by Opalis. The header of the action log comment is <Workflow name> <Result>, the comment is <Result> <Workflow name> <Computer name> as shown in the figure above, result below. This makes the update action log workflow easy to use for all workflows, they just need to forward workflow name, computer and incident number.

The second troubleshooting workflow checks a process and a service on the machine, and then updates the incident.

This export file have meet “mr Wolf†so it should not contain any unnecessary settings or objects. You can download my policies here, ZIP-file, please note that this is provided “as is†with no warranties at all. Also please read this blog post about export and import of policies.
System Center Service Manager 2010 Unleashed Book is up on Amazon
We are in the final stages of copy edit for the System Center Service Manager 2010 Unleashed book now. It’s up on Amazon now available for pre-order. The release date on Amazon says around October, but I’m pretty sure it
will be something more like this summer when it is actually released though. Hopefully you will find lots of new and useful information in this book! Link to the book

Dynamic web farm with Opalis, VMM, OPSMGR and SCSM
I have built a scenario where I use Opalis, Virtual Machine Manager, Operations Manager and Service Manager to control number of web servers in a web farm. The web farm is behind a NLB cluster. The scenario was to only have enough with IIS running, no extra IIS machines that is not doing anything. If one IIS can handle the current load, there should only be one IIS online.
We use Service Manager to track what is happening. Opalis executes and Service Manager remembers. As soons as Opalis is done, it will drop everything, it only keeps it in memory during execution (and maybe some logs). Working with Service Manager will give us a great way to track everything.
Operations Manager are monitoring my IIS machines, if IIS01 is running low on resources an alert will be raised. If any other IIS in the web farm is idle another alert will be raised. When an alert about high load on IIS01 is raised the first Opalis policy starts. When an alert about a idle IIS is raised the “shut down” policy will start.

The purpose of this policy is to start a extra IIS, that is already in the web farm. The IIS will then relieve pressure from IIS01 that is running low on resources.
- The first activity monitor Operations Manager for new alerts about IIS01 running low on resources
- Set resolution state of the alert in Operations Manager to a Opalis resolution state. This makes sure no one else picks it up, instead you can see that Opalis is working on it in the Operations Manager console
- We use a counter to decide which IIS to start, this activity reset the counter to 0
- This activity gets all running machines from Virtual Machine Manager that is named something with IIS0. I have three IIS, named IIS01, IIS02 and IIS03.
- For each running IIS machine, add one to the counter (+1)
- The merge step is used to merge multiple treads, we don’t want to run the rest of the policy more the once. If step 4 returns multiple IISs a Junction activity is a good way to terminate parallel treads. One thing to remember here is that the merge step don’t publish any data from activities before it, so that is why we need to read the counter again.
- Reads counter value
- Add one (+1) to the counter. Each running VM added one to the counter and we want to start the next free IIS. If there is only one IIS running the value will be “1” then we add “1” and gets “2”. In step 9 we use that “2” to start IIS02
- Gets VM with name IIS0<Output from 8>, for example IIS02
- Create a change request in Service Manager saying the web farm is running low on resources and we need to add a extra IIS. We also include that we need to start the machine that we picked up in step 9
- Start the virtual machine. If it fails we will update set the change request to failure and add information around it, also generate an alert in Operations Manager
- Wait four minutes to make sure the virtual machine is up and running
- Trigger a policy to remove maintenance mode from Operations Manager
- Wait three minutes to make sure the maintenance mode is stopped
- Check if the web page is working on the IIS machine. If it fails we will set the change request to failure and add information around it, also generate an alert in Operations Manager
- Update the change request with result and change it to completed
The Stop Maintenance Mode policy is used to stop maintenance mode for machines that was shut down by Opalis earlier. This policy check if the affected machine is in maintenance mode, by checking Windows Computer (1), Health Service (2) and Health Service Watcher (4). We use a SQL query to get the agent watcher ID (3). These are the three objects that Opalis puts into maintenance mode when it shuts down a IIS in this example. Another example of Opalis and maintenance mode here.

The stop IIS policy will look for an alert in Operations Manager saying a IIS is idle, it will then shut down the IIS. In one version of this policy I added a run command activity that drain the IIS first from active sessions before shutdown.

- Monitor for an alert saying that a IIS is idle
- Set resolution state of the alert in Operations Manager to a Opalis resolution state. This makes sure no one else picks it up, instead you can see that Opalis is working on it
- Create a change request in Service Manager saying we will shut down a IIS, including name and reason
- Get VM to shutdown
- Put the Windows Computer into maintenance mode
- Put the Health Service into maintenance mode
- Query the OperationsManager database for the agent ID
- Put the agent watcher into maintenance mode
- Wait three minutes to make sure the maintenance mode is active
- Shutdown the machine (VM)
- Wait four minutes to make sure the machine is down
- Verify that the machine is down, else update the change request with a status equals failure and generate an alert in Operations Manager
- Update the change request with success and set status to completed
- Close the alert in Operations Manager
A couple of pictures of change requests in Service Manager


In this scenario and example I used two unit monitors in Operations Manager to trigger on a performance counter, to decide if IIS01 was running low on resource or if another IIS was idle. As the NLB will decide the load equal between my IIS machines I only measure load on IIS01, if I had two IIS online and IIS01 was low on resources IIS02 was that too.


In the first policy there should be a thread checking if already all IIS is running, then create a change request saying we need more IIS machines in the web farm. Or trigger another policy to create a new VM, configure it and include it in the web farm.
This export file have meet “mr Wolf†so it should not contain any unnecessary settings or objects.
You can download my policies here, ZIP file, please note that this is provided “as is†with no warranties at all. Also please read this blog post about export and import of policies.
Identify problems with Opalis and Service Manager
I have created a Opalis workflow that checks number of active incidents related to a business service. If there are more the X (in my example 4) incidents active a problem work item will be generated. The problem work item will be assign to the problem managers Active Directory group.

The policy is divided into three parts. Part one will find the business service and active related incidents. Â
Â
- Starts at 6 am every day
- Deletes the temporary file if it exists. The link after “Delete temp file” is configure to continue even if the “Detete temp file” activity fail, becurse there is no file to delete.
- Gets the business service, in my example “Contoso – Extranet”
- Gets related incidents to the business service
- Gets the incident workitem for each incident that is in relationship with the business service
- If the incident status is equals active, the policy continue over the link, else nothing more will happen
Part two will count number of active incidents and see if there are more incidents then the threshold. In my example the threshold is 4.

- Â If the status of the related incident in the first part of the policy is active, the GUID of the incident will be echo to a temporary file.
- The Junction activity is used to combine multiple threads to one. As multiple incidents can get back from “get related incidents” we need to make sure the rest of the policy is not ran in multiple threads, we use a junction activity for that. Â
- The combine activity is configure not to publish any data, that why we need to get the business service again. If we choose to publish data the policy might run multiple times and we dont want multiple problem work items.
- This activity count the number of lines in the temporary file
- Â Checks if number of lines in the file (number of active related incidents) are equal or more then the incident threshold
- If there are enough with related incidents the policy will move on
Part three will create a problem and assign it to problem managers. It will also link the problem to the business service and all the incidents to the problem.

- Created a problem work item with some dynamic text depending on the settings in the rest of the policy
- Link the new problem work item to the business service
- Query Active Directory to get the Problem Managers (in my example) security group
- Writes a platform even with the problem work item ID
- Assign the problem work item to the Active Directory group found in “Get Problem Managers from AD” activity
- Reads each line in the temporary file. Each line is a GUID of a related and active incident
- Link each active and related incident from the temporary file to the problem work item
The following two images show the problem work item created in Service Manager. Note that all incidents are related to the problem work item and that it is assign to problem managers.


To save some data processing you could move the “Get Business Service GUID” activity to the other side of “Compare Values” activity. Then you could not contact Service Manager a second time if there was not enough with incidents. The “Get Business Service GUID” result is used in the “Link Problem to Service” activity.
This export file have meet “mr Wolf” so it should not contain any unnecessary settings or objects.
You can download my policies here, 21 Problem Management clean, please note that this is provided “as is†with no warranties at all. Also please read this blog post about export and import of policies.
Generate SCSM Incident with Opalis
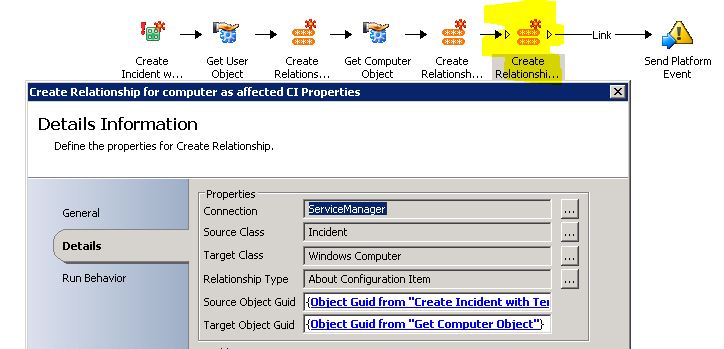
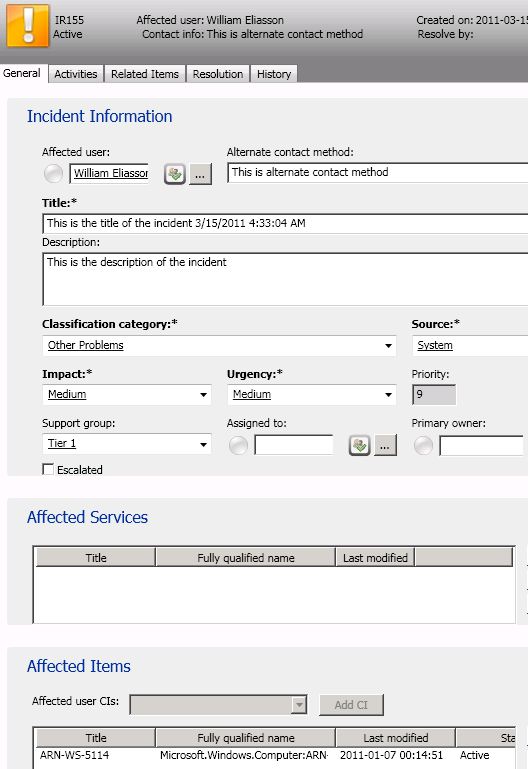
I read a question on the forum about creating a incident in Service Manager with Opalis. The question was about all the fields you see in the incident form in Service Manger, but not on the “Create Incident with template” activity in Opalis. Many things we see in Service Manager as one form is a combination of objects and relationships between classes. Some more info about that in this post. Opalis handle this object per object and relationship per relationship. In the following policy I create a incident and create a relationship to a user and a computer. The computer is added as related CI and affected CI.

- Creates a incident in Service Manager
- Gets a user from the CMDB
- Create a relationship between the incident and the user
- Gets a computer object
- Create a relationship between the incident and the computer, as related CI
- Create a relationship between the incident and the computer, as affected item
- Sends a platform event


Generate demo e-mails with Opalis
Every time I need to check something around the Exchange management pack I realize there there is not much mail traffic in my sandbox. The main reason is of course because there are no users. The result is that there is not much to look at with the management pack. I have solved this with a number of Opalis workflows. In this blogpost I will show you the solution
The Exchange Demo policy is actually six policies,
- 3.1 Internal – Create folder and file. Creates a temporary folder to store the address file in.
- 3.2 Generate address list. Export e-mail addresses from Active directory to a address file in the folder created by 3.1.
- 3.3 Generate TO and FROM addresses. Random pick a FROM and TO address from the address file
- 3.4 Send Internal Mail. The “main” policy that trigger the others, based on a interval
- 3.5 Generate subject. Generate a random subject
- 3.6 Multiple Internal mails. Used to send a fixed number of e-mails
The solution starts with 3.4 – Send Internal Mail.

This policy run based on a interval, think in my sandbox it is every 30 seconds. It first trigger policy 3.3 and then 3.5. It will wait until each of the policies are done, before it sends a e-mail and writes to a logfile. The e-mail that is sent is based on the data that policy 3.5 and 3.3 sends back on the data bus. Lets look at policy 3.2 and 3.1 first.

Policy 3.2 will first check if a temporary file exists, this file path is set by a variable. If the file exists it is deleted. The policy then list all enable users from the Active Directory, and writes each e-mail address to a temporary file. The file is created in a folder that policy 3.1 generate. These two policies only needs to be run once, or if you want to generate a new address list from your Active Directory. The address file is named CCemails.txt.

Lets move on to policy 3.3. This policy start with get number of lines in the address file that policy 3.2 generated. Depending on number of lines it will go one of two different directions from the “Compare Number of Lines” activity. The yellow part is just a reminder that I have only built the “less then 99 lines” path, so if you have more then 99 lines in your address file, make sure you build that path of the policy too. It should look the same as the one I have built, just it should generate random numbers with three digits instead of two. It is actually not really about 99, more about number of characters in the number. The result is that the first break point is 99 and next 999. Number of characters is important in the next activity because the “Generate random text” activity can generate a random number based on number of digits, not between 0 and 25, instead that will be 0 and 99 or 0 and 999.


Next we will fin these four activities. The purpose of those is to get a FROM address and a TO address from the address file generated in policy 3.2. We can use the “Generate Random Text” activity to create a number with 2 digits, but what if we only have 20 lines in the address file? That is why we also use a Compare Values activity, to see it the random number generated is equals to a line in the address text file.

- Will generate a two character long random number
- Will see if the number from step 1 is equal to a line in the address file, if it is it will continue to 3, else it will loop and go back to 1 again to generate a new number.
- Will generate a two character long random number
- Will see if the number from step 3 is equal to a line in the address file, if it is it will continue else it will loop back to 3 again to generate a new number
The last three activities will read the e-mail address used as FROM address and the line use as TO address from the address file. It will then publish the data to the data bus, and back to policy 3.4. Policy 3.4 generate two random numbers, and then maps them to a e-mail subject and a e-mail abbreviation. The result of this is then published on the data bus and used by policy 3.4


Policy 3.4 will then send a e-mail based on the SUBJECT, TO and FROM information that has been generated. It will also write to a logfile. As you can see I start policy 3.4 every 30 seconds. That is a interval you should adapt to your own environment. These policies use a number of variables that also need to be adapted to the current environment
 There is one more policy, “3.6 Multiple Internal Mails”. This policy is used when you want to send a fixed number of e-mails, not based on time interval. You can configure the number of mails to send with a counter and the policy will then loop until the number is reached, for example if you want to send 150 random e-mails. The policy use the same policies to generate FROM, TO and SUBJECT as policy 3.4 do.

After some time you will see nice demo data in Operations Manager. Both performance views and reports will have data in them. I once forgot about the policy a couple of days, and the Exchange management pack started generate alerts about mail queues, mailbox stores out of space and a lot of other interesting things 🙂 The following picture is showing the Exchange message tracking tool, showing all the e-mails Opalis is sending.

You can download my policies here, ExchangeDemoMails_v2, please note that this is provided “as is†with no warranties at all. Also please read this blog post about export and import of policies.
Recent Comments