Home » Articles posted by Anders Bengtsson (Page 23)
Author Archives: Anders Bengtsson
 Incident Management in System Center Service Manager
 System Center Universe
  Related dates in Service Manager views
Asset Management MP for Service Manager 2010
In a collaborative project we, Patrik Sundqvist and Anders Bengtsson have created an embryo of an Asset Management extension for Service Manager. Our thoughts behind this management pack are to build a version one that we could extend in the future. It is not a feature complete asset management solution for enterprise organizations, but it is a foundation that could give you some ideas what you could do with Service Manager 2010.
Download management pack here and there management pack guide here. If you have any ideas or feedback, send us a e-mail.


Target software packages to a group of users
I tested to modify my announcement customization management pack from this post to extend the package class instead. It works really well, I can target packages to a group of users or to everyone. The following post can be a little bit confusing if you have not read this first, please do.
The management pack looks like this

I can configure a package for which group it will be available in the self service portal. The user can then request the software, a change request must still be approved before they get it. The result is that instead of all users see all packages from Configuration Manager in the self service portal, they only see the package assigned to their group. When I was testing it I used the same groups as in this post.
Target knowledge to a group of users
I tested to modify my announcement customization management pack from this post to extend the knowledge article class instead. It works really well, I can target knowledge articles to a group of users or to everyone. The following can be a little bit confusing if you have not read this first, please do.
- Added one new property to the System.Knowledge.Article class, called Group
- On the extension tab of the knowledge article form, I configured target group for the article, for exaple 5 for all and 2 for HR
- Create a new dynamic group for each department, for example the HR group
- Name: Contoso – Knowledge – 2 HR or Everyone
- Management Pack: Contoso Knowledge Extension (same as the class extension)
- Dynamic members
 Â
 - For everything else in the group wizard I use default settings
- Updated the security user roles from the other post to include also this new group
- That would do it 🙂

 Â
Â
 Â
Â
Â
Target IT Announcement to a group of users in Service Manager
This week I have done some tests with IT announcements in Service Manager 2010. What I wanted to do was to target a IT announcements to a group of users and another announcements to another group of users. This can be done, but includes a number of steps and some XML coding. These are the general steps
- Extend the announcement class with a new property
- Sort your announcements in different categories with the new property
- Include you different announcement categories in dynamic groups
- Create new security user roles for your end users, one role for each target group of users
Travis has a good post about extending classes. In this example I extend the announcement class and adds a property named “group”.

Service Manager is using a standard form when creating new announcements in the console. That is default, if not form is target it will use a default form and show you all properties for the class. So In this scenario you dont need to customize the form. As soon as you import the management pack with the extension, and creates a new announcement the new property is in the form.

Next step is to sort your announcements. There is a number of ways to do it but one example could be that your company contains of four departments and that you want to base announcements on departments. You assign each department a number and then one for all departments, for exampleÂ
- IT
- HR
- Manufacturing
- Development
- All departments
Now open all your announcements and configure them with the correct announcements target number (department number) in the group field. After that we need to create groups that contains the correct announcements. We will use the groups in security user roles to control who will see which announcement. Create one group for each department, for example for the HR department
- Group Name: Contoso – Announcement – 2 HR
- Management Pack: Contoso Announcement Extension
- Dynamic Members: [Contoso.Announcement.ExtensionClass] Assigned to group equals 2 ORÂ Â [Contoso.Announcement.ExtensionClass] Assigned to group equals 5
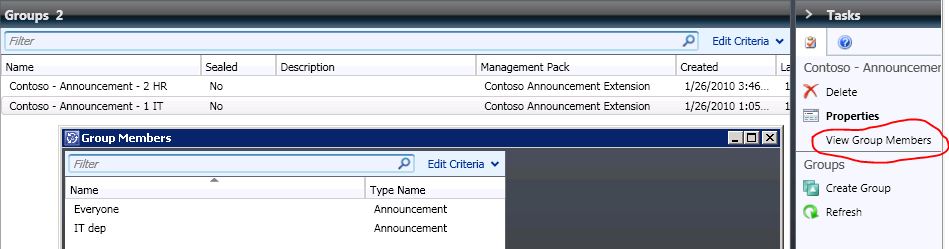
We will need to include 5 in each group as we want all departments get announcement target to 5 – ALL. There is a “View group members” task that you can use to verify that you have the correct annoncements in each group. Remember to save your groups in the customization management pack you imported.
Â
Next step is to configure user roles. With default settings all authenticated users can read all IT announcements. Start by removing authenticated users from the default end-user user security role. Then create a new advanced operator user security role for each department. For example for HR
- General, Name: Contoso – Advanced Operator – HR
- Management Packs: Select All
- Queues: select provide access to only the selected queues and don’t select any
- Groups: Select the Contoso – Announcements – 2 HR group
- Tasks: select provide access to only the selected tasks and don’t select any
- Views: select provide access to only the selected views and dont select any
- Form Templates: All forms can be accessed
- Users: Select your HR users
- Summary: Click Create and close the wizard
If you now log-on to the self service portal as a user from the HR department you will only see announcements target to ALL (5) and HR (2). If you include that use in the default end-user security user role it will see all announcements again, even if it is still in the restricted HR security user role. If a user in one of the new advanced operator roles open the Service Manager console they will see the work items, Library and Configuration Items (DW not installed) workspaces including sub views. But there is no information anywhere in the console, for example they will not see any incidents and no computers.
Microsoft TechDays 2010
I will deliver a sessions at TechDays 2010 in Örebro/Sweden. My session “Operations Manager 2007 R2 tips and trix” is a level 400 session with a lot of good tips from the field. I will show a number of custom solutions and solutions to problems I often see at customers.
I will also spend time in the exhibit area as my employer Atea is the main sponsor for the event, so stop by and say hi. See you in Örebro!

Â
More info about the event here
Related dates in Service Manager views
My collegue Patrik and I is playing with Service Manager in the sandbox today. We just notice a nice feature when creating views. You can create them based on related dates. For example if you want to show all items modified the last week you could configure the view according to the picture below.

Auditing files in Windows with ACS
I have been doing some tests for file auditing with Audit Collection Services (ACS). Unfortunately Windows file auditing doesn´t really generate informative logs. It is most often the same event ID and the event description is very technical. I did some file operations and reviewed all events in the security event log. I think I have found a way to almost sort all the different file operations in different ACS reports. The first thing you need to do is enable auditing in both a policy and on the folder. I have used the built-in Microsoft Report Builder to create my new ACS reports. You can read more about creating ACS reports here. I have built four reports. You could merge them into one and you can add/remove any parameter you want. It could be nice with relative dates and an input field for user name and object name. One of the first thing I did was match ACS report parameters with parameters in security events, below is the result from that exercise
- String01 – Object Type
- String02 – Object Name
- String03 – Process ID
- String04Â – Process Name
- String05 – Accesses
- String06 – Object Server
- String07 – Handle ID
- String08 – Transaction ID
- String09 – Access Mask
- String10 – Privileges Used for Access Check
- String11 – Restricted SID Count
For the four reports I use the following filter
- Contoso – File – Created Files
- Event ID equals 4656
- String 09 equals 0x6019f
- or
- String 09 equals 0x16019f
- Event ID equals 4656
- Contoso – File – Delete
- Event ID equals 4663
- String 05 contains DELETE
- Contoso – File – Modified Files
- Event ID 4656
- String 09 equals 0x2019f
- or
- String 09 equals 0x12019f
- Event ID 4656
- Contoso – File – Open/Read Files
- Event ID equals 4656
- String 09 equals 0x120089
- or
- String 09 equals 0x20089
- Event ID equals 4656
Summary: You read the step by step guide about ACS reports in my ACS report post and you apply the filter is this post.

Infrastructure Planning and Design Guide Series
I want to tip you about a serie of documents that I often use in System Center projects.
The Infrastructure Planning and Design (IPD) series provides guidance for Microsoft infrastructure products. The series is a collection of documents that leads the reader through a sequence of core decision points to design an infrastructure for Microsoft products. It also provides a means to validate design decisions with the business to ensure that the solution meets the requirements for both business and infrastructure stakeholders.
The IPD documents are designed to be used by the following IT personnel:
- Infrastructure planners and architects who have a firm operational grasp of the technology.
- Partners and consultants who design infrastructure solutions.
- Business managers who want to understand how the technology decisions being made both support and affect the business.
You will find the documents here
Reading a logfile with a 3 state monitor
If you build a monitor to monitor a logfile, Operations Manager will remember which line it was reading last. Operations Manager will only look for new keyword below that line, it will not read the whole file again. I did a lot of tests with logfile monitoring, read more about them here. If you need to get Operations Manager to read the whole logfile each time, you can use a scrip like this:
Â
Const ForReading = 1
Set oAPI = CreateObject(“MOM.ScriptAPI”)
Set oBag = oAPI.CreatePropertyBag()Set objFSO = CreateObject(“Scripting.FileSystemObject”)
Set objTextFile = objFSO.OpenTextFile _
(“c:\temp\file.txt”, ForReading)Do Until objTextFile.AtEndOfStream
strText = objTextFile.ReadLinevarWarPos = Instr(strText, “Warning”)
If varWarPos > 0 Then
varStatus = “Warning”
varLine = strText
End IfvarCriPos = Instr(strText, “Critical”)
If varCriPos > 0 Then
Call oBag.AddValue(“Line”, strText)
Call oBag.AddValue(“Status”,”critical”)
Call oAPI.Return(oBag)
Wscript.Quit(0)
End IfLoop
objTextFile.CloseIf varStatus = “Warning” Then
Call oBag.AddValue(“Line”, varLine)
Call oBag.AddValue(“Status”,”warning”)
Call oAPI.Return(oBag)
Wscript.Quit(0)
Else
Call oBag.AddValue(“Status”,”ok”)
Call oAPI.Return(oBag)
End If
This script will read the file (c:\temp\file.txt) line by line. The script is looking for two keywords in the logfile, “Warning” and “Critical”. If there is a “Critical” in a line the script will send back a bag with status=Critical and the script will stop. If there is a “Warning” in the line the script will continue, as there might be a “critical” somewhere too. If there was only “Warning” the script will send back status=Warning. If there was no “Warning” or “Critical” the script will send back status=ok.
If there is a “Warning” or “Critical” the script will also put that line into a bag, and send it back to Operations Manager. You will see this line in the alert description. To use this script, you can configure a monitor like this:
- Create a new monitor of type Scripting/Generic/Timed Script Three State Monitor. Input a suitable name and target. More about targeting here.
- Schedule
- Configure your script to run every X minute. The script will rad the whole logfile each time
- Script
- Filename and Timeout, for example CheckFile.vbs and 2 minutes
- Paste the script in the script field
- Unhealthy expression
- Property[@Name=’Status’]
- Equals
- Warning
- Degraded expression
- Property[@Name=’Status’]
- Equals
- Critical
- Healthy expression
- Property[@Name=’Status’]
- Equals
- ok
- Alerting
- Check Generate alerts for this monitor
- Generate an alert when: The monitor is in a critical or warning health state
- Check Automatically resolve the alert when the monitor returns to a healthy state
- Alert name: Input an alert name
- Alert Description
- State $Data/Context/Property[@Name=’Status’]$
- Line $Data/Context/Property[@Name=’Line’]$
Summary: This monitor, including the script, will read a logfile and generate alerts based on keywords. In will read the whole logfile each time and look for two different keywords.
Custom alerting based on distributed applications
I ran into a interesting scenario some time ago. A customer have first line operators online 24/7. During none business hours they receive all alerts and needs to call the on-call engineer if needed. But first line don’t have deep knowledge about the environment so sometimes the alerts from Operations Manager is a bit complicated to connect to a service, for example if the alert only tells you that database Y has a problem, and also to understand how critical the alerts are. For example if only one IIS in the IIS farm goes offline, they should not call the on-call engineer in the middle of the night.

We had for example a service including two Windows services. As long as one of them are running, there should not be an alert, and if there is an alert, it should include a simple non-technical description. First we needed to create a distributed application with the two services. We used the Configure Health Rollup feature to configure rollup algorithm to “best health state”. As long as any service is health, the component box will be healthy.

When one of the services are stopped, you will receive an alert telling you for example “the print spooler service on computer X has stopped running”. If you don’t need it you can override the monitor and configure it not to generate alerts. When booth services are down the distributed application will switch to critical status. But you will not receive an alert, only for the two services included in the distributed application.
If you need an alert when both services are offline, when the component box switch state, you can override the aggregate rollup monitor in the distributed application. Override it to both configure the alert description and also rename the alert to get a better alert name in the console. In this scenario I override the aggregate monitor on top of my two Availability monitors.
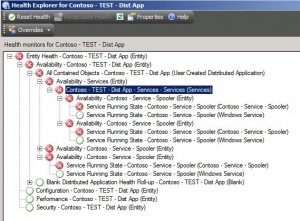
Now when both services are offline I get one alert, saying that first line should contact the on-call engineer.

Recent Comments