Home » Azure » Monitor Linux Daemon with Log Analytics

Contoso.se

Welcome to contoso.se! My name is Anders Bengtsson and this is my blog about Microsoft infrastructure and system management. I am a principal engineer in the FastTrack for Azure team, part of Azure CXP, at Microsoft. Contoso.se has two main purposes, first as a platform to share information with the community and the second as a notebook for myself.

Everything you read here is my own personal opinion and any code is provided "AS-IS" with no warranties.

Anders Bengtsson

MVP
MVP awarded 2007,2008,2009,2010

My Books
Service Manager Unleashed
Orchestrator Unleashed
Orchestrator 2012 Unleashed
OMS
Inside the Microsoft Operations Management Suite

Contoso.se

Welcome to contoso.se! My name is Anders Bengtsson and this is my blog about Azure infrastructure and system management. I am a senior engineer in the FastTrack for Azure team, part of Azure Engineering, at Microsoft.  Contoso.se has two main purposes, first as a platform to share information with the community and the second as a notebook for myself.

Everything you read here is my own personal opinion and any code is provided "AS-IS" with no warranties.


MVP awarded 2007,2008,2009,2010

My Books

Service Manager Unleashed


Orchestrator 2012 Unleashed


Inside the Microsoft Operations Management Suite

Monitor Linux Daemon with Log Analytics

In this blog post I would like to share an example of how daemons on Linux machines can be monitored with Log Analytics. Monitoring daemons are not listed as a feature direct in the Log Analytic portal, but it is possible to do. When a daemon is started or stopped a line is written in Syslog. Syslog is possible to read with the Microsoft Monitoring Agent and send to Log Analytics.

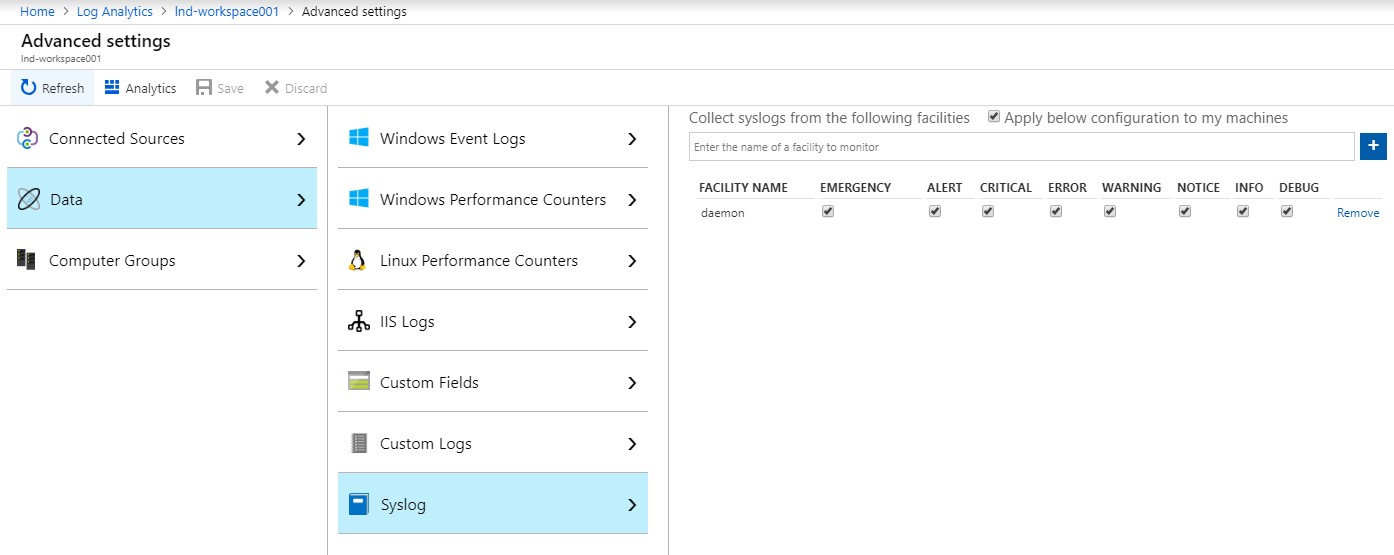
The only thing to configure is to enable collection of Syslog and the daemon facility.

If the daemon is stopped (the cron daemon in this example) the following lines are written to the syslog logfile

Soon after the same lines are written to Log Analytics as events in the Syslog table

You can now configure an alert including notification when the daemon stops. The alert can, for example, be visualized in Azure Monitor and sent by e-mail.


Disclaimer: Cloud is a very fast-moving target. It means that by the time you’re reading this post everything described here could have been changed completely.
Note that this is provided “AS-IS” with no warranties at all. This is not a production-ready solution for your production environment, just an idea, and an example.


2 Comments

  1. As there is no reoccurring “heartbeat” from a service or daemon, from that perspective it is a bit difficult. If you can measure the delta between a stop/start event, there should be a way to estimate “downtime” during a time window.

Leave a comment

Your email address will not be published. Required fields are marked *

This site uses Akismet to reduce spam. Learn how your comment data is processed.