In the Azure Portal, under a Azure Automation account, we can review automation jobs for example number of successfully jobs last seven days. This is all good, but let’s say we need to know which service do we spend most automation minutes on? What source start most runbook jobs? How many minutes did each job take? Which jobs ran on a specific hybrid worker group? In this blogpost I will show an example of how this can be accomplished with PowerBI (PowerBI is an analytics service from Microsoft), a Azure SQL database and a runbook 🙂
All automation job data can be read with PowerShell, including some information we don’t see in the portal. This information can then be written, with PowerShell, to an Azure SQL database that PowerBI reads. We can then user PowerBI to drill down into the automation job data. This example includes two major steps
- A scheduled PowerShell based Azure Automation runbook gets all Azure Automation job data from the Azure Automation account. The data is in some case modified by PowerShell, for example some characters are replaced before they are stored in the database. PowerShell also calculate minutes spent per runbook job based on Start and End time from the runbook job data. The last part of the runbook writes the job data to the Azure SQL database
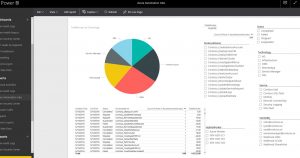
- PowerBI is configured to use the Azure SQL database as data source. PowerBIÂ reads the data and present it in a web based dashboard that you can configure/design any way you want. In the figure below you can see an example of the PowerBI dashboard. On the right side of the figure you can see different parameters that can be used to filter the data and drill deeper into it.
In the figure below I have selected OMS as technology and all the other fields are adapted to only show OMS related information, for example only workers that have run a OMS related runbook.
If you look at the PowerBI figure you can see that we can filter on technology and service. This is based on tags configured on each runbook. The runbook in step one export this data too and writes it to the Azure SQL database. With these tags we can group runbooks together, based on owner, technology, service, integration or any other way we need to group them. In the figure below you can see how tags are configured on each runbook. If you run the example runbook with no tags on your runbooks the data export will work anyway, just that in PowerBI you will see “Not Configured” as service, technology and type of runbook.
Summary: We use a Azure Automation runbook to write automation job data to a Azure SQL database. PowerBI then reads the Azure SQL database and present the data in a easy way. You can then use PowerBI to drill down into the data
Note that this is provided “AS-IS†with no warranties at all. This is not a production ready solution for your production environment, just an idea and an example.
Download the example runbook here. Download SQL script to setup the database here.


Recent Comments