 Finding correct permissions for custom roles in Azure RBAC
 Protecting Exchange 2007 with DPM 2007
 Consider Invoke Runbook activities when doing a runbook update
Show number of hours a computer has been sending heartbeats, per day
Today I needed a Kusto query to show number of heartbeat events per computer, per day, for the last week. The query also needed to estimate number of hours based on the amount of heartbeat events. The query is similar to the query in the Return data only during office hours and workdays post.
Heartbeat
| where Computer == "ninja-linux" or Computer == "WORKSTATION13"
| where TimeGenerated >= startofday(ago(7d))
| summarize minutes = count() by bin(TimeGenerated, 1d), Computer
| project Date = format_datetime(TimeGenerated, 'dd-MM'), Computer, WeekDay = case(
dayofweek(TimeGenerated) == "1:00:00:00", "Mo",
dayofweek(TimeGenerated) == "2:00:00:00", "Tu",
dayofweek(TimeGenerated) == "3:00:00:00", "We",
dayofweek(TimeGenerated) == "4:00:00:00", "Th",
dayofweek(TimeGenerated) == "5:00:00:00", "Fr",
dayofweek(TimeGenerated) == "6:00:00:00", "Sa",
dayofweek(TimeGenerated) == "0:00:00:00", "Su",
"Unknown day"), Hours = minutes / 60, Events = minutes
| order by Date

Custom availability monitoring
What if you need to monitor something that require a custom script? For example a sequence of checks? That is possible with a PowerShell script that do all the checks, and then submit the result to the workspace. In this example I will monitor port 25565 on a Minecraft server with a PowerShell script. Monitoring a network port is possible with the network insight feature, but it is still a good example as you can change the PowerShell script do do almost anything.
The first step was to create an Azure Automation runbook to check if the port is open. The runbook submit the result to Log Analytics through the data collector API.

A challenge with the runbook is schedules only allow it to run once per hour. To trigger the runbook more often, for example every five minutes, we can trigger it from a Logic Apps.

The PowerShell based runbook is now triggered to run every five minutes, sending its result to the Log Analytic workspace. Once the data is in the workspace, we can query it with a query, and for example show availability of the network port. As you can see on line six in the query, I have comment (for demo purpose) the line that shows only events from yesterday. The following blog post, Return data only during office hours and workdays , explains the query in details.
let totalevents = (24 * 12);
Custom_Port_CL
| extend localTimestamp = TimeGenerated + 2h
| where Port_s == "Minecraft Port"
| where Result_s == "Success"
// | where localTimestamp between (startofday(now(-1d)) .. endofday(now(-1d)) )
| summarize sum01 = count() by Port_s
| extend percentage = (todouble(sum01) * 100 / todouble(totalevents))
| project Port_s, percentage, events=sum01, possible_events=totalevents
The query will show percentage availability based on one event expected every five minutes.

% Free Space for Linux and Windows servers
In the workbook published yesterday we used one graph for %Used Space from Linux servers, and one graph for %Free Space from Windows servers. But for some scenarios you might want to show disk space from both server types in the same graph. The following query convert Linux %Used Space to %Free Space, so they can be visualized together with %Free Space with data from Windows servers.
Perf
| where TimeGenerated between (ago(1d) .. now() )
| where CounterName == "% Used Space" or CounterName == "% Free Space"
| where InstanceName != "_Total"
| where InstanceName !contains "HarddiskVolume"
| extend FreeSpace = iff(CounterName == "% Used Space", 100-CounterValue, CounterValue)
| extend localTimestamp = TimeGenerated + 2h
| extend description = strcat(Computer, "  ", InstanceName)
| summarize avg(FreeSpace) by bin(localTimestamp, 10m), description
| sort by localTimestamp desc
| render timechart
Thanks to Vanessa for good conversation and ideas 🙂
Workbook Template
Today I want to share a workbook template that I often use. It has some basic parameters for subscription, tags, timeframe, VMs and workspace. The “services” parameter use tags to list virtual machines. For example if I select SAP from the services drop down, all virtual machines with a tag service set SAP will be visualized in the Virtual Machines drop down box.
The following images shows to the Service and Virtual Machines parameters are configured. The last image shows an example of using both Timeframe and Virtual Machines parameters in a Kusto query.
You can download the template in Gallery Template format here.


Compare the current counter value with previous one
Today I received a question about comparing a performance counter value with the previous performance counter value. In the example, we look at free space on C and compare the current value with the previous. As there are few examples in the community, I thought this would be a good example to share.
Perf
| where Computer == "idala"
| where CounterName == "% Free Space"
| where InstanceName == "C:"
| serialize | extend prevValue = prev(CounterValue, 1)
| extend diffvalue = CounterValue - prevValue
| extend trend = case(CounterValue < prevValue, "Free Space Reduces",
                      CounterValue > prevValue, "Free Space Increases",
                    "No difference")
| project TimeGenerated, InstanceName, CounterValue, prevValue, diffvalue, trend
| order by TimeGenerated desc
First, we filter on a computer, counter name, and instance name. Before we can use Window functions on the result, we need to SERIALIZE it. SERIALIZE will freeze the result; in other words, freeze the order on the rows.
We use EXTEND to create a new column and assign it the value of the previous counterValue. “1” after CounterValue means we look on the 1 previous row; this is possible to do as we have a serialized set of rows.
We then use EXTEND to create a new column that will hold the difference (diffvalue) between the current counter value and the previous counter value.
Even if it is simple to see if the value has reduced or increased manually, we use CASE, and another EXTEND to write different text strings in a column depending on the current counter value and previous counter value.
Counting Devices
Today I would like to quickly share two queries. The first query counts number of devices that sent a heartbeat last month. The second query shows the number of devices sent heartbeat per month, for the current year.
let LastMonthEndDate = (startofmonth(now()) - 1h);
let LastMonthStartDate = startofmonth(LastMonthEndDate);
Heartbeat
| where TimeGenerated between(LastMonthStartDate .. (LastMonthEndDate))
| distinct Computer
| summarize ['Devices Last Month'] = count()
let YearStartDate = (startofyear(now()) - 1h);
Heartbeat
| where TimeGenerated between(YearStartDate .. (now()))
| extend Month = (datetime_part("month", TimeGenerated))
| summarize Devices = dcount(Computer) by Month

Trigger a runbook based on an Azure Monitor alert, and pass alert data to the runbook
Last week Vanessa and I worked on a scenario to trigger Azure automation based on Azure Monitor alerts. We notice the lack of documentation around this, so we thought we could share our settings. We will not go into recommended practices around trigger automation jobs for faster response and remediation. Still, we would recommend you read the Management Baseline chapter in the Cloud Adoption Framework, found here. Enhanced management baseline in Azure – Cloud Adoption Framework | Microsoft Docs. The chapter covers designing a management baseline for your organization and how to design enhancements, such as automatic alert remediation with Azure Automation.
The scenario is that a new user account is created in Active Directory. A data collection rule collects the audit event of the new user account. An alert rule triggers an alert based on the latest event and triggers an Azure Automation Runbook.
The blog post will show how to transfer data from the alert to the runbook, such as information about the new user account.
A new user account is created, named Sara Connor.

A security event is generated in the audit log.
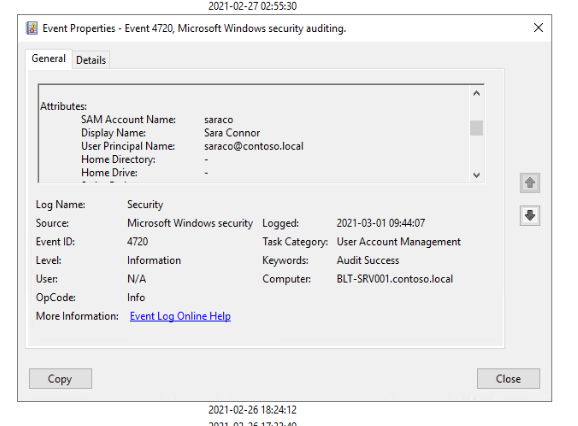
The event is collected and sent to Log Analytics by a data collection run.

An alert rule runs every five minutes to look for newly created accounts. The alert rule triggers the runbook. Note that the alert rule uses the Common Alert Schema to forward event information.


Information about the common alert schema at Microsoft Docs. Below is the query used in the alert rule, and the runbook code.
Event
| where EventLog == "Security"
| where EventID == "4720"
| parse EventData with * 'SamAccountName">' SamAccountName '' *
| parse EventData with * 'UserPrincipalName">' UserPrincipalName '' *
| parse EventData with * 'DisplayName">' DisplayName '' *
| project SamAccountName, DisplayName, UserPrincipalName
Runbook:
param
(
[Parameter (Mandatory=$false)]
[object] $WebhookData
)

# Collect properties of WebhookData.
$WebhookName    =   $WebhookData.WebhookName
$WebhookBody    =   $WebhookData.RequestBody
$WebhookHeaders =   $WebhookData.RequestHeader

# Information on the webhook name that called This
Write-Output "This runbook was started from webhook $WebhookName."

# Obtain the WebhookBody containing the AlertContext
$WebhookBody = (ConvertFrom-Json -InputObject $WebhookBody)
Write-output "####### New User Created #########" -Verbos

Write-Output "Username: " $WebhookBody.data.alertContext.SearchResults.tables.rows[0] -Verbos
Write-Output "Display Name: " $WebhookBody.data.alertContext.SearchResults.tables.rows[1] -Verbos
Write-Output "User UPN: " $WebhookBody.data.alertContext.SearchResults.tables.rows[2] -Verbos
This is the output from the runbook, including details about the new user account.


Sending SMS notification of Azure Sentinel alerts, through Azure Monitor
In Azure Sentinel, all alert responses are driven by Playbooks. Playbooks are Azure Logic Apps, that allow everything automation from simple send e-mail to complex integration scenarios.
Last week we were working in a scenario where we needed to send alert notification as text messages (SMS). There are several 3rd party connectors available in Logic Apps, but Azure Monitor provides this capability out of the box, without the need for additional agreements. Without any experience, I would personally guess that the 3rd party connects have more features, for example, the possibility for engineers on duty to confirm alert notification by a test message. But in this example, we only need to send text messages.
All alerts raised within Azure Sentinel, as well as Azure Security Center, are written into the SecurityAlert table in the Azure Monitor Logs workspace. You can use the following query to view which products have raised alerts into this table in the last 60 days:
SecurityAlert
| where TimeGenerated between (ago(60d) .. ago(5m))
| summarize by ProductName
If you have connected products like Microsoft Cloud App Security or Microsoft Defender ATP, you may also see these listed as a product:

Alerts raised by the analytics rules in Azure Sentinel will have the ProductName property set to Azure Sentinel. As the alert data is stored in the SecurityAlert table in the Azure Monitor Logs workspace, it is possible to leverage built-in capabilities in Azure Monitor Alerts for responses.
In this example, we will use Azure Monitor to raise alerts from the Sentinel data for “Failed logon attempts within 10 minsâ€. This is a default rule in Azure Sentinel.

The following query show the alerts we want to be notified about. This query is executed in the workspace that Azure Sentinel is using. Once we test the query in Logs, we can use it to configure an alert rule in Azure Monitor.
SecurityAlert
| where ProductName == "Azure Sentinel"
| where ProviderName == "ASI Scheduled Alerts"
| where AlertName == "Failed logon attempts within 10 mins"

In this example we create a new action group to send out the notification, by text message.


Once the action group is configured, and the alert rule, the phone number we included will get a SMS saying welcome to the action group. When a new alert is raised a text message notification will be sent out, as shown in the image below.

Have you noticed the Export button?
Earlier this week, Vanessa and I were working with exporting data from Log Analytics to a CSV file. Previously, this has always been done with the API. But nowadays we have an Export button to direct export the result from the current query. On the Export drop down menu we also have the options to export to PowerBI.
From the Export menu, we can choose the CSV format direct. In the screenshot, you can see there is an option to export all columns or displayed columns. Displayed columns are the ones you project in the query. All columns are, in this example, all columns in the VMConnect table. We can then easily massage and format the data in Excel if needed. Very quick compared to writing a script exporting the data 😊


Azure Monitor Data Ingestion Workbook
Last couple of weeks Vanessa and I have been working with analyzing costs for a Log Analytics workspace. As part of this work, we built a workbook, and of course, we want to share this workbook with the community
The idea with the workbook is to help identify the top data ingestion sources, especially around Computers, to help with optimizing the costs of using Azure Monitor. The workbook has two tabs, one to look at cost based on computer and one to look at cost by data type.


The “By computer†tab visualizes the total amount of ingested data by the server and the estimated data ingestion cost for this data. The price is calculated on a parameter where you input cost per GB. If you select a server, in this example dc01, another table will be visualized to show the amount of data, for each data type, for the selected server. For instance, in the screenshot, we can see that dc01 has ingested 1.13 GB performance data.
The second tab, “By data type†tab, visualize the total amount of ingested data by data type, and the estimated data ingestion cost for this data.
The “Azure Diagnostic” tab visualizes the total amount of ingested data by Azure Diagnostics, and the estimated data ingestion cost for this data.
The “Trends” tab compare data ingestion between two time periods. This tab visualize the ingestion difference between the two time periods and if the trend is decreased on increased.
The workbook is provided as a sample of what is possible. It does not replace current cost management tools or invoices from Microsoft. The costs in this workbook are estimated prices only and are not an official statement or invoice from Microsoft.
Download the workbook at GitHub.
Recent Comments